
California solar & storage, in 5 minutes
Is solar worth it for your home?
Most solar advice assumes a roof, a bill, and a sunny day that look nothing like yours. Answer five quick questions and watch the numbers build. No account, no sales call, no email required.
Where’s the home?
Your address tells us the sun, roof, and utility rates for your exact spot. We pull the roof from a 3-D sun model, not a guess.
We read your actual roof from a 3-D sun model and price everything on your own utility’s current rates, never a statewide average. Until you analyze an address, the numbers use a real California utility’s rates so you can feel the flow.
How do you live in the home?
When you use power matters more than how much, because the sun only shines midday. Pick the one that fits best, then add any big loads you have.
Each bar is one hour of an average day. The dashed gold line is when the sun produces. The more your usage sits under that line, the more solar is worth to you.
What’s a typical month?
Slide to your average monthly electric bill. Watch your usage shape rise and fall, and notice how different each California season looks.
Each panel is one average day, hour by hour. Taller bars are heavier use. The dashed gold line is when the sun is producing.
Continue →Your roof, and how much to build
The real design next to the real shade, straight from the 3-D sun model. Then size the system by the bill cut you want.
The design
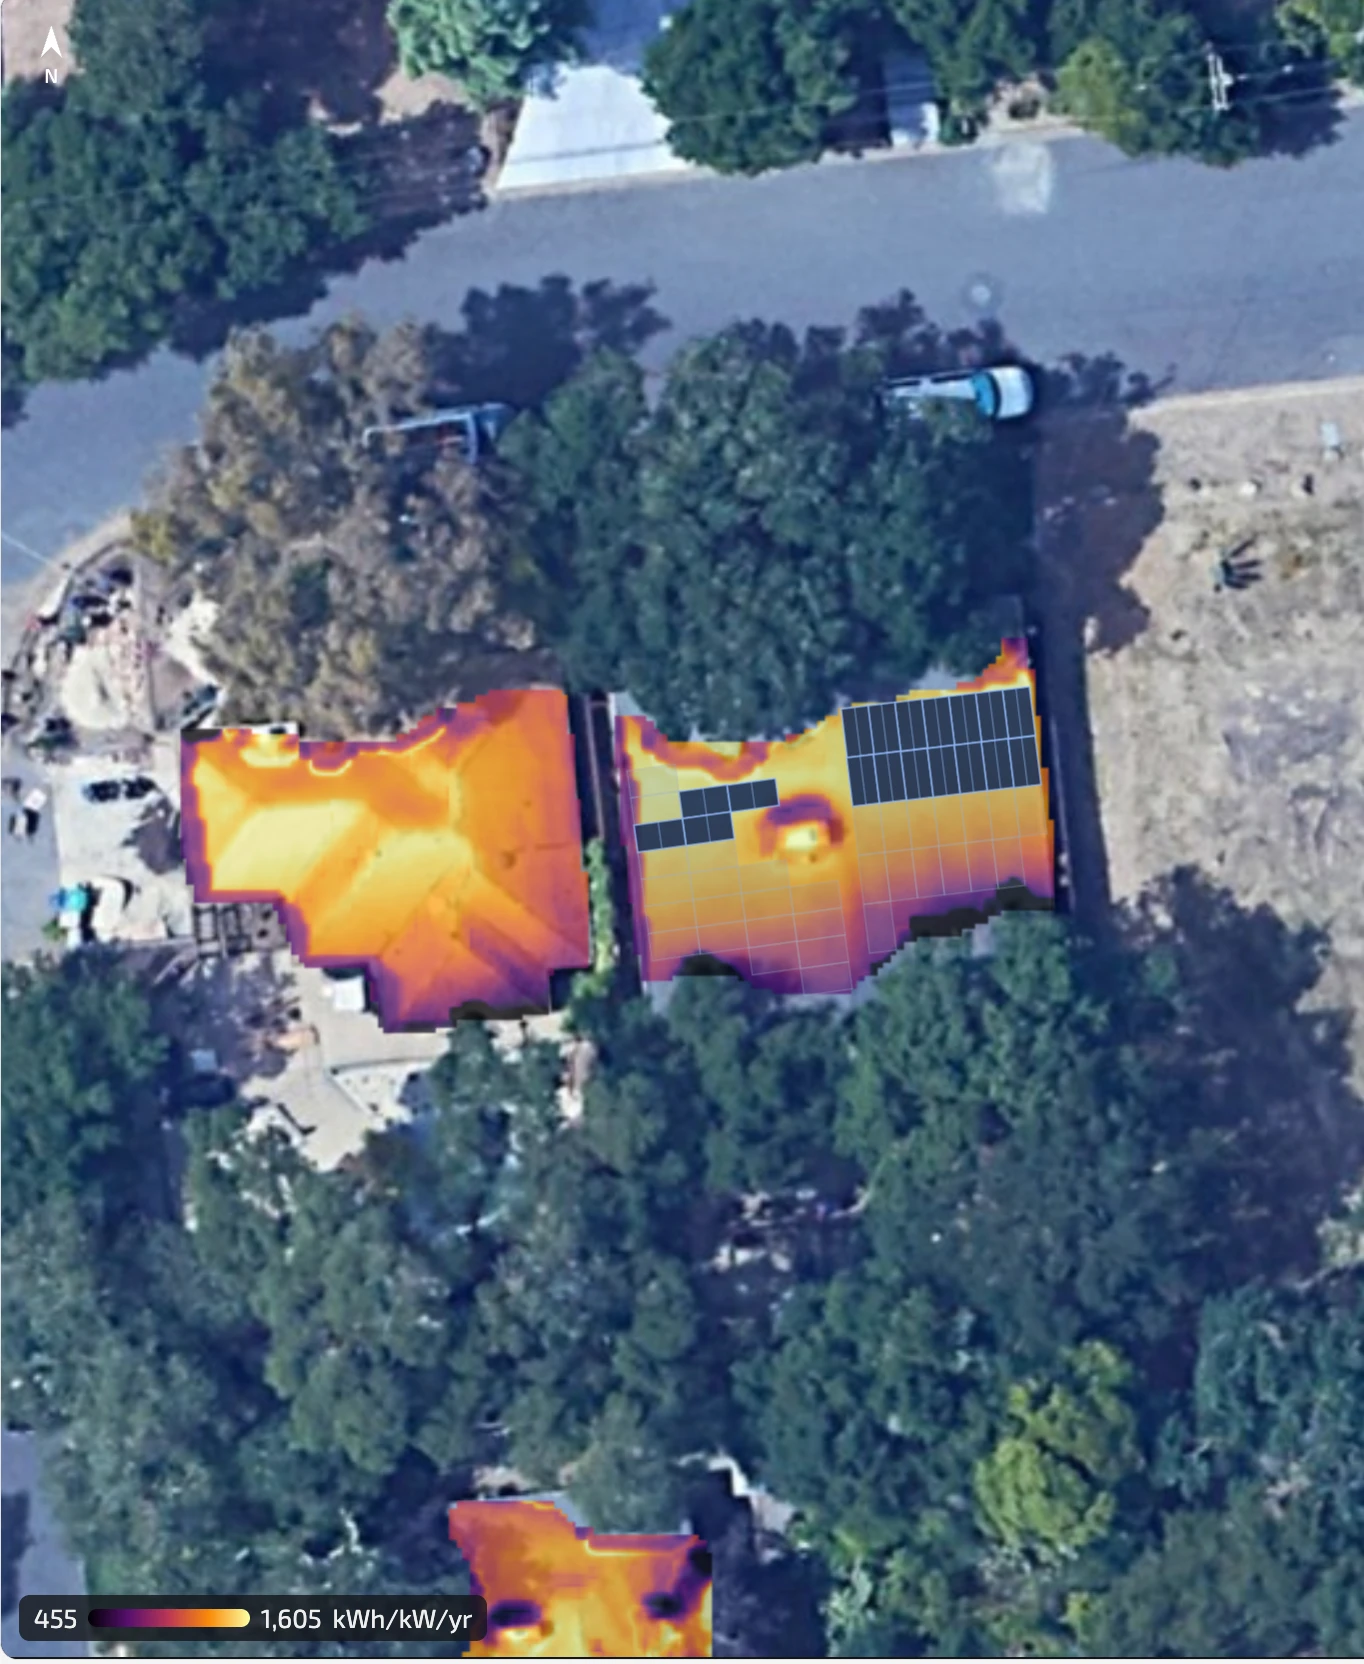
Where the panels sit, on the annual sunlight map of the roof. Warm colors catch the most sun, so the array goes where the roof stays bright.
The shade, through the year
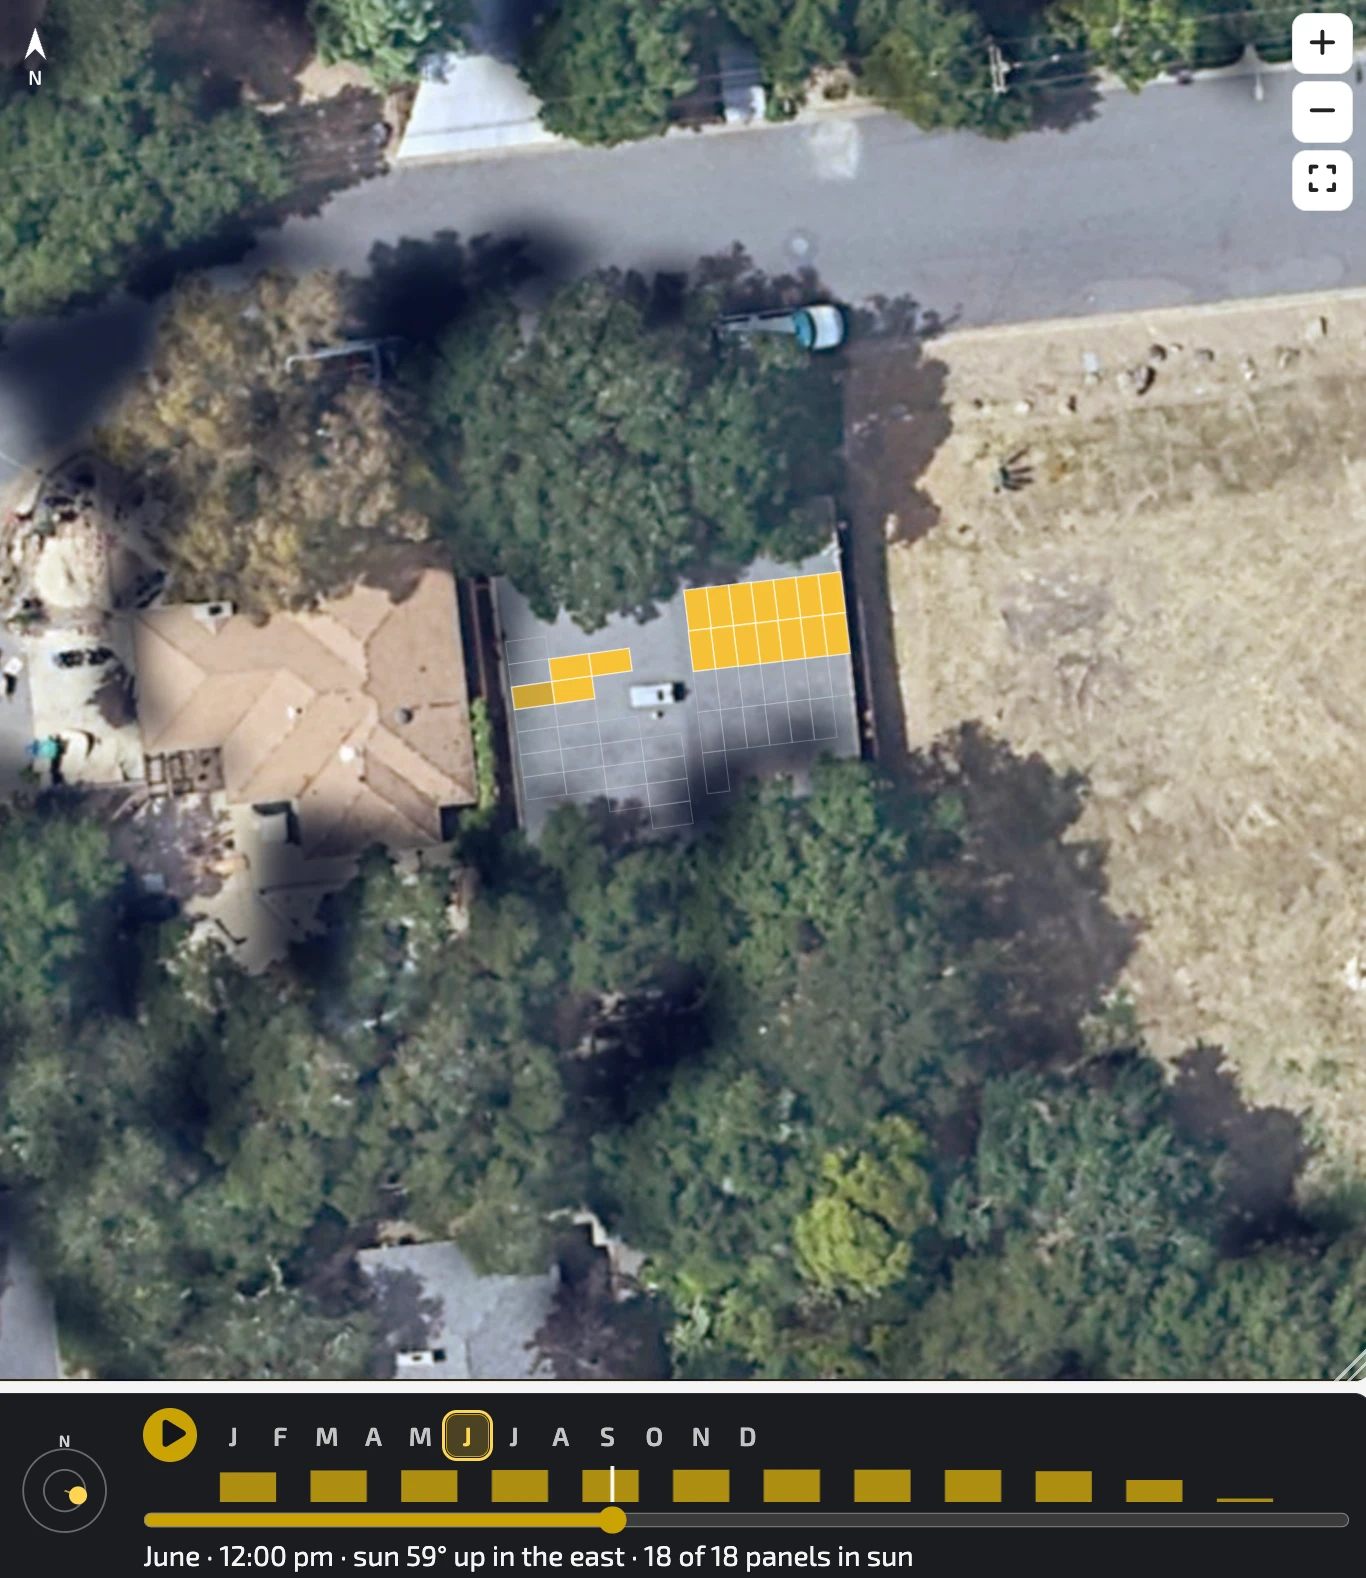
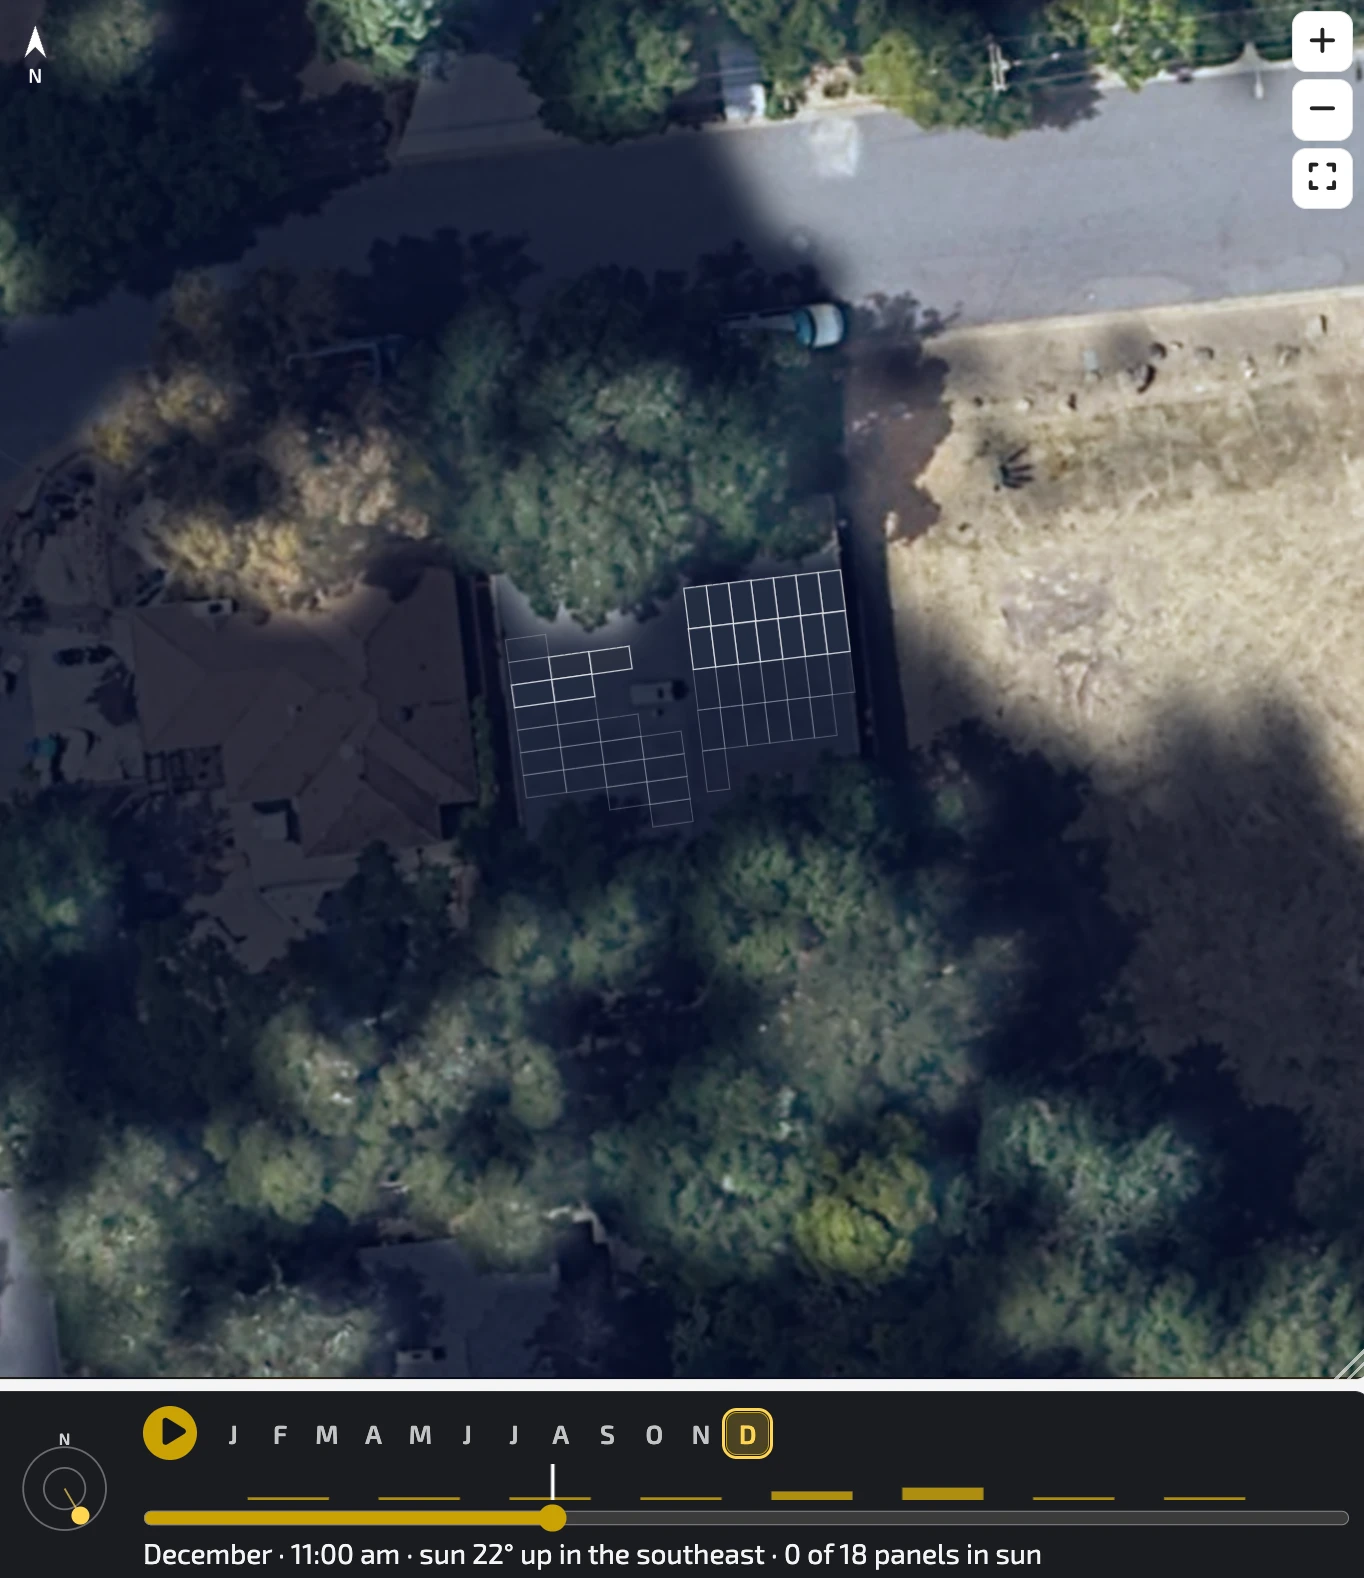
How a roof’s shade shifts through the year: summer’s high sun clears the trees, winter’s low sun throws the longest shadows. Your own roof’s shade is measured into the sun map on the left and the production numbers below.
The verdict
Everything you picked, turned into real numbers. Incentives are already applied. Compare it to leaving the same money in the stock market.
Solar pays off well on this home.
What it costs
Solar vs. the stock market
Where your savings come from
Step 6 · Your next move
Two ways to go from here
Do it yourself
Run the full calculator
Open the full Solar Design Studio and take the wheel: move panels around the roof, edit your utility rates, add a battery, model your exact loads. The same engine behind this page, with every dial in your hands.
Open the full calculatorWhite-glove · free
Get a report handmade for you
A former solar-energy scientist hand-builds you a full written analysis of your home — roof, shade, real rates, every lifestyle — plus an optional, low-pressure chat about going solar if you want one. No sales pitch, no obligation, and we never sell your details.
Request my free reportIndependent. Not affiliated with any solar company. We equip you and support you whenever you ask for it.
How these numbers are estimated
This preview is built to be transparent and roughly recreatable, not to replace a site visit.
- Electricity is priced on a real California utility’s current rate plan, not a statewide average. The full tool uses your own utility’s exact rates, read live from your address.
- Production uses a California solar yield per kW, adjusted for the roof’s actual measured shade from the 3-D model.
- Savings follow the big utilities’ NEM 3.0 rules: power you use as it’s made is worth full retail, surplus you export is worth about a quarter of that, and a battery shifts surplus into your evening.
- Install price uses a current regional market price per watt for quality equipment, before incentives. The federal residential tax credit ended at the close of 2025, so it is $0 here; a state storage rebate is applied only when you add a battery, where available.
- Return is a 25-year internal rate of return with modest rate escalation and panel aging, set against a long-run stock-market return near 10%.
This tool runs the same model as our published research. See the full studies — is solar worth it in PG&E territory, in SCE territory, in Massachusetts and in Illinois — or browse all the research.