
Want this analysis for your own home?
Built by hand by SIA’s founder, an ex‑solar‑energy scientist.
Email your address and you’ll get a ~25‑page report within one business day:
- Your best system, with and without a battery
- Payback and 25‑yr savings — cash, loan, lease, PPA
- Every incentive that applies to you, your real shading, and what moves the numbers
See a real example (PDF) · Learn more
- Free, no sales calls, and an honest verdict.
Opens your email app.
Your details go to our inbox only — never sold or shared. Privacy policy
Is solar worth it in SCE territory? We modelled 67 real homes to find out
We took 67 real homes across 26 cities in Southern California Edison territory, measured every roof individually, and asked one question: is going solar still worth it under NEM 3.0?
The short answer
Yes, and by more than we expected. Every one of the 67 homes came out ahead — not most of them, all of them.
The three numbers that matter
Payback
5.0 years
on the rate SCE puts you on
SCE moves new solar customers onto TOU-D-PRIME. On that rate the typical home pays for itself in 5.0 years and earns 21.4% a year, tax free. On the rate you are on today it is 7.9 years. Same roof — the tariff is doing that.
What to pay
$3.00 a watt
a good price in SCE territory
What the best-priced quarter of SCE buyers actually paid: about $12,000 for a 4.0 kW system. The typical buyer paid $3.65. Price is the one thing on this page you control.
Over 25 years
$65,108
median, after everything you pay
Money left in your pocket once the system is paid for, on TOU-D-PRIME. On today’s rate it is $35,316. Every home we modelled cleared our bar for a good investment on both.
Same roofs, same panels, same sunshine. The only thing that changes is which tariff the household is on.
The thing nobody tells you
Going solar in SCE territory changes your electricity rate. You do not stay on Domestic D; SCE requires new solar customers to move to TOU-D-PRIME, which charges most between 4pm and 9pm and least around midday.
That sounds bad for solar — you generate at midday, when the rate is low. It is not. The rate you avoid paying in the evening is high, and the model prices every hour separately rather than smearing an average across the year. The result is that TOU-D-PRIME is worth far more to a solar owner than the flat rate: $65,108 against $35,316 over 25 years.
NEM 3.0 did not kill solar here
The common story is that California gutted solar in April 2023 by cutting what exported power earns to about a quarter of retail. Our own numbers say the damage is real but much smaller than the story: a home on the old NEM 2.0 rules pays back in 4.6 years, and the same home on NEM 3.0 with TOU-D-PRIME pays back in 5.0.
Under the old rules: 4.6 years. Under the new rules, on the rate SCE puts you on: 5.0 years. Five months of difference, not five years.
Every home cleared the bar on both of today’s tariffs. The spread is narrow because SCE territory is consistently sunny and the rate is consistently high.
A battery did not pay for itself on a single home
We tested storage on all 67 homes, on both tariffs, letting the model pick the best battery for each roof. It paid back on none of them. A battery may still be worth buying for backup when the power goes out — that is a different question, and a fair one. But it does not pay for itself on the savings alone, and anyone telling you otherwise is selling one.
What this does not tell you
It is 67 homes, not yours. Your roof, your usage and the price you are quoted all move the answer. That is what the calculator is for: it runs this same model on your own address in about a minute, and every number on this page came out of it.
Southern California Edison serves fifteen million people, and almost every piece of solar advice they read was written about somewhere else. This is the Southern California Edison companion to our PG&E study — same method, same engines, different utility, and a materially different answer.
What makes solar profitable here
Three things, in this order. The price of the electricity you stop buying — SCE’s standard residential rate is about 40c a kilowatt-hour, among the highest in the country. How much sun your roof actually gets, which we measure rather than assume. And what you pay for the system, which is the only one of the three you control.
What does not drive it, contrary to how solar is usually sold: the size of your bill, the size of your roof, or whether you add a battery. We tested all three and none of them decides whether solar is worth doing here.
SCE prices electricity by the hour on TOU-D-PRIME. The evening peak is what solar lets you avoid buying, which is why a flat-rate estimate gets this wrong.
The rate SCE moves you to
This is the part almost nobody is told. Going solar in SCE territory changes your electricity tariff. You do not stay on Domestic D; SCE requires new solar customers to move to TOU-D-PRIME, which charges most between 4pm and 9pm and least around midday.
That sounds bad — you generate at midday, when the rate is low. It is not. The power you avoid buying in the evening is expensive, and our model prices every hour separately instead of smearing an average across the year. On these 67 roofs TOU-D-PRIME is worth $65,108 over 25 years against $35,316 on the flat rate. Same panels, same sunshine.
If an installer shows you savings calculated on the rate you pay today, they have modelled a tariff you will not be on. Ask for TOU-D-PRIME.
What the April 2023 rule change actually cost a household here — real, and a long way from fatal.
Is a 21% return good?
It is the number that makes people suspicious, so it is worth being concrete. A 21.4% annual return, tax-free, on an asset bolted to your house, is higher than the long-run return of the US stock market — and unlike the market it does not depend on anyone else’s opinion of what your panels are worth. It is not speculative: it is the price of electricity you would otherwise have bought, which you can read off your own bill.
The catch is liquidity, not risk. You cannot sell half a solar array when the boiler breaks. The money is in the roof for twenty-five years, and that is the honest reason to be careful, not the return.
It also assumes SCE’s rate keeps climbing at roughly 2.5% a year, which is below its recent trend. If rates rise faster, this understates. If California somehow makes electricity cheap, it overstates.
Where a 5.0-year payback comes from: the up-front cheque, then annual savings that grow as the rate does.
What changed in 2023, and what it cost
In April 2023 California replaced net metering with NEM 3.0, cutting the credit for exported power to roughly a quarter of retail. The received story is that this killed residential solar. On our numbers it cost 2% of lifetime value and 5 months of payback — real, and a long way from fatal.
The reason is arithmetic rather than optimism. A home on a time-of-use tariff consumes much of what it generates instead of exporting it, and the exports were never the bulk of the benefit. Cutting the price of the smaller half does not halve the whole.
1. The research question
Under NEM 3.0, with no federal tax credit left for a purchase, is rooftop solar still a good investment for an ordinary SCE household — and what decides whether it is?
“Good” is not ours to define loosely. We use the bar the calculator itself applies: payback within ten years and 25-year savings above $15,000. A design has to clear both.
2. The sample
Where the 67 came from. Cities SCE does not serve are excluded by name, and every home re-checked against the utility lookup.
Seventy-five detached homes drawn at random from OpenStreetMap building records across 30 SCE cities; 67 had a usable Google roof model. Nothing was hand-picked and no home was dropped for producing an inconvenient answer.
Municipal utilities matter more in SCE’s footprint than anywhere else in California. Los Angeles (LADWP), Anaheim, Riverside, Pasadena, Burbank and Glendale run their own systems and mostly still offer full retail net metering, so a house there is not on NEM 3.0 and does not belong here. Those cities are excluded by name, and every remaining home is checked against the utility lookup rather than assumed — all 67 came back SCE.
Neighbourhood income was recorded for each home from ACS tract data: 19 of 67 sit below 80% of their county median. Median system 4.0 kW, 1654 kWh per kW per year.
3. Two tariffs, one roof
SCE files a flat residential rate (Domestic D, 40.0c) and TOU-D-PRIME, the time-of-use rate it requires new solar customers to take. Solar generates at midday; a household consumes most in the evening. A flat rate and a time-of-use rate therefore value the same roof very differently, and the model prices every hour separately rather than smearing an average across the year.
| Regime | Median payback | Median 25-yr | Return | Worth doing |
|---|---|---|---|---|
| Domestic D — today’s rate | 7.9 yrs | $35,316 | 13.2% | 67 of 67 |
| TOU-D-PRIME — the solar rate | 5.0 yrs | $65,108 | 21.4% | 67 of 67 |
| Legacy NEM 2.0 — before Apr 2023 | 4.6 yrs | $66,370 | 22.8% | 67 of 67 |
The gap between the first two rows is the largest single effect in this study, and it is not a choice the homeowner makes. SCE makes it for them.
Same roofs, same panels, same sunshine. Only the tariff changes.
4. What NEM 3.0 actually cost
NEM 3.0 pays roughly a quarter of retail for an exported kilowatt-hour, against full retail under NEM 2.0. The received story is that this killed California solar. Our numbers say the damage is real and much smaller than the story: 2% of lifetime value, and 5 months of payback.
The reason is that a home on TOU-D-PRIME consumes much of what it generates rather than exporting it, and the exports it does make were never the bulk of the value. Cutting the price of the smaller half of the benefit does not halve the benefit.
One roof taken apart: planes, pitch, azimuth and the sky each face can see.
4a. What the model actually sees
Three of the 67, chosen to span the shading range rather than to flatter the result. The left column is Google’s aerial photograph. The right is the same roof as its annual flux raster measures it — one reading of annual sunlight for every 10 cm of roof — with the panels the model actually placed drawn on top.
What the roof looks like
What the model measures
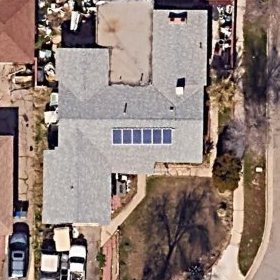
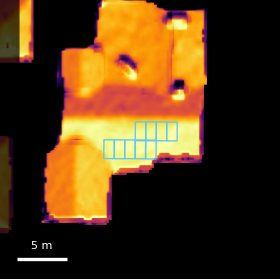
Lancaster — open. High desert, almost nothing overhanging the roof. Mean shade factor 0.886 · 1,844 kWh per kW per year · 3.6 kW over 9 panels.
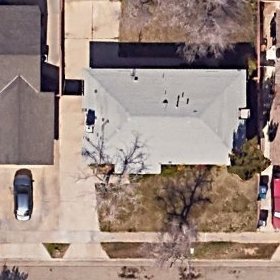
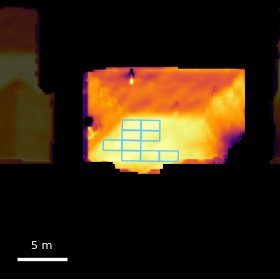
Lancaster — typical. The middle of our shading range, and near-identical output to the open roof: in this climate a little shade costs very little. Mean shade factor 0.883 · 1,838 kWh per kW per year · 3.6 kW.
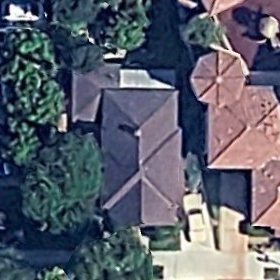
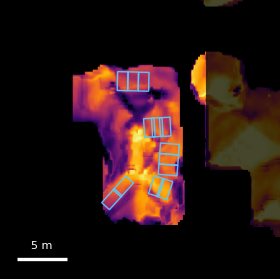
Santa Ana — the most shaded of the 67. Trees and neighbouring buildings take a real bite, and the yield shows it. Mean shade factor 0.837 · 1,295 kWh per kW per year · 5.2 kW over 13 panels.
Even the worst-shaded roof in the sample still cleared the good-investment bar. Shading changes how much you get, not whether it is worth doing — at least in this territory.
5. How big a system should you buy?
Each additional panel sells more of its output at the export rate, so the return per dollar falls as the system grows.
Why the model stops where it does: each additional panel earns less than the one before it.
Bigger is not better, and the reason is the export haircut: every kilowatt-hour past your own consumption is sold at about a quarter of what you would have paid for it. We re-sized every home from half its annual load to 120% of it.
| Sized to | Covers | Payback | Return | 25-year savings |
|---|---|---|---|---|
| 50% of load | 55.0% | 3.8 yrs | 28.1% | $46,820 |
| 70% | 76.6% | 4.3 yrs | 24.6% | $55,670 |
| 85% | 88.9% | 4.5 yrs | 23.3% | $59,916 |
| 100% | 104.0% | 5.0 yrs | 21.2% | $64,926 |
| 120% | 126.3% | 5.4 yrs | 19.5% | $69,969 |
Two different answers depending on what you are optimising. A half-size system pays back fastest (3.8 years, 28.1% return) and a full-size one keeps the most money ($69,969 at 120%). The return per dollar falls steadily as the system grows, because each extra panel sells more of its output at the export rate. Anyone pushing you to fill the roof is optimising the invoice, not your return.
6. Does it still work if you use very little power?
When a California home actually uses electricity — the shape that decides how much of your own generation you keep.
Your bill sets the size of the prize, not whether there is one.
A common worry: solar only pays for big households. We ran every home at four consumption levels, sizing the system to each.
| Annual usage | System | Payback | 25-year savings |
|---|---|---|---|
| 4,000 kWh — a small flat | 2.8 kW | 5.1 yrs | $43,236 |
| 6,036 kWh — California average | 4.0 kW | 5.0 yrs | $64,926 |
| 10,000 kWh | 6.4 kW | 4.9 yrs | $107,172 |
| 14,000 kWh — an EV and air conditioning | 9.2 kW | 5.0 yrs | $148,294 |
Payback barely moves — 5.1 to 4.9 years across a three-and-a-half-fold range of consumption. What changes is the size of the prize, not whether it is worth taking. Using little power does not disqualify you; it just means a smaller system.
7. The one lever you control
You cannot change your roof, the weather or SCE’s tariff. You can change what you pay.
| Installed price | Who pays this | Payback | Return |
|---|---|---|---|
| $3.00/W | best-priced quarter of SCE buyers | 5.0 yrs | 21.4% |
| $3.65/W | typical SCE buyer | 6.0 yrs | 17.8% |
Paying the typical price instead of a good one costs about a year of payback and roughly 3.6 points of return. That is the difference between two quotes for the same hardware on the same roof, which is why getting more than one is the highest-value hour you will spend on this.
8. If you cannot pay cash
With 25D gone there is no federal credit on a purchase, so the up-front figure is simply the price: about $12,000 for the median system here. We modelled a 15-year loan at 7% with 10% down.
$1,200 down · $97/month payment · $188/month saved — cash-positive from the first month, and $58,745 over 25 years.
That is a genuinely different answer from PG&E territory, and it follows from SCE’s higher rate and lower installed prices. It also assumes a clean loan: a dealer fee buried in the price, which Berkeley Lab puts at 5–50% of the up-front cost, changes it substantially. Ask what the cash price would be, and compare.
9. Does a battery make sense?
The best battery in the catalogue, on every one of the 67 roofs. None of them pays for itself on savings alone.
Generation, household load and a battery across one day. The battery moves midday surplus into the evening peak; it just costs more than the move is worth.
We let the model pick the best-performing battery from the calculator’s own catalogue of real products at real prices, for each of the 67 roofs, on both tariffs. None paid for itself. The median home ended up about $1,900 worse off than with solar alone.
Under NEM 3.0 a battery’s job is to move midday generation into the evening peak rather than export it at a quarter of retail. That is real value — it is simply less than the hardware costs at today’s prices.
What changes the arithmetic is a rebate. California’s SGIP pays per kilowatt-hour of storage on a declining scale, and the equity tiers are far larger than the general market steps:
| SGIP step | Rebate | Net battery cost |
|---|---|---|
| General market, Step 7 | $150/kWh | $13,375 |
| General market, Step 5 | $250/kWh | $12,025 |
| Equity Resiliency | $1,000/kWh | $1,900 |
Equity Resiliency needs the household to be income-qualified and in a high fire-threat district or subject to repeated shut-offs. We checked every home against the CPUC fire map: 7 of 67 sit in a fire-threat district, and 2 meet both tests. For those two the battery question is entirely different.
And backup during an outage is a separate reason to buy one. This study prices savings, not peace of mind, and does not pretend the second is worth nothing.
10. Three sales pitches, checked
“Fill the roof — bigger is better.” Not for your return. Going from half-size to 120% of load takes payback from 3.8 to 5.4 years and the return from 28.1% to 19.5%. It does raise total savings, so it is not a lie — but it is the invoice talking, and you should know which you are optimising.
“You need a battery to make NEM 3.0 work.” Not on these numbers. Every one of the 67 homes cleared the good-investment bar with no battery at all, and adding one cost the median household money.
“Act now before the rates change.” The rate already changed, in April 2023, and solar still pays here. Urgency is a sales technique; the arithmetic is patient.
11. Before you sign
- Ask for the cash price. If financing is involved, a dealer fee is usually inside the quoted price. The cash price tells you what the system actually costs.
- Check the $/W. Divide the price by the system size in watts. Under $3.00 is a good price in SCE territory; $3.65 is typical.
- Confirm the tariff. You will move to TOU-D-PRIME. Ask the installer to show the savings on that rate, not the one you are on now.
- Question the size. A system much larger than your annual usage sells the surplus at about a quarter of retail.
- Treat the battery as a separate decision. On savings alone it did not pay on any home here. If you want backup, price it as backup.
- Get a second quote. The price spread between installers is worth more than every other decision on this list combined.
Every home cleared the bar on both of today’s tariffs. The spread is narrow because SCE territory is consistently sunny and its rate is consistently high.
12. Method, and what this does not tell you
From an address to a payback number: every step, and where each input comes from.
- Roofs. Google’s 3-D building model for shading, orientation and tilt; NREL PVWatts for production, hour by hour. Every roof measured individually.
- Price. $3.00/W, what the best-priced quarter of SCE buyers paid for host-owned solar-only systems (CA DG Stats interconnection records, 4,500 systems, Jun 2025–May 2026), with $3.65/W — the median — as the sensitivity.
- Rates. SCE Domestic D and TOU-D-PRIME as filed, from our URDB snapshot, frozen in the archive so the study can be rebuilt exactly.
- Assumptions. 25 years, no federal credit (25D expired 31 Dec 2025), 2.5% utility inflation, 0.5%/yr degradation, $34/kW-yr O&M (NREL ATB), 5% discount rate, NEM 3.0 exports at 25% of retail.
- What it does not tell you. Whether your roof is like these; what an installer will actually quote you; or whether you are on CARE, which changes the answer substantially and is the subject of the low-income SCE study.
Every figure on this page came out of the same calculator you can run on your own address in about a minute. Where two of our methods disagreed — a battery analysis valuing a synthetic system against the catalogue of real products — we report the calculator’s own answer and say so, rather than quietly choosing the more flattering of the two.
Read next
The same method across PG&E territory, where the answer is materially worse — a 10.4-year median payback against SCE’s 5.0, and only 24 of 56 homes clearing the bar. The comparison is the argument for running this per utility rather than per state.
Is solar worth it in PG&E territory? →