
Want this analysis for your own home?
Built by hand by SIA’s founder, an ex‑solar‑energy scientist.
Email your address and you’ll get a ~25‑page report within one business day:
- Your best system, with and without a battery
- Payback and 25‑yr savings — cash, loan, lease, PPA
- Every incentive that applies to you, your real shading, and what moves the numbers
See a real example (PDF) · Learn more
- Free, no sales calls, and an honest verdict.
Opens your email app.
Your details go to our inbox only — never sold or shared. Privacy policy
Is solar worth it in PG&E territory? We modelled 56 real homes to find out
We modelled 56 real homes across PG&E territory, roof by roof, to answer one question: is going solar still worth it for homeowners in 2026? Here is what we found, in plain English.
The short answer
Yes, it still pays. Every one of the 56 homes we modelled came out ahead.
Our three takeaways
Payback
7.5 years
for a half-size system
Half-size means it covers about half the electricity you use. Of every size we tested it paid back the fastest, and the payback got longer the more of your usage the system covered: about 10½ years to cover all of it, 11.5 years at 120% of it.
What to pay
$3.10 a watt
a good price for PG&E customers
What the best-priced quarter of PG&E homeowners actually paid last year: about $13,600 for a system covering a typical home's whole usage. The typical buyer paid $3.97 a watt, and at that price payback slips from about 10½ years to nearly 13.
Batteries
0 of 56
homes where a battery paid off
Buy one for backup during power shutoffs, not to save money.
Your home, your numbers
But is it worth it on your roof?
This study is the average across the homes we modelled. Yours is different — your roof, your shade, your bill, your utility. Run the same model on your own home in about 30 seconds. Free, no account, no phone number.
Check my home free →What makes solar profitable here
Four things decide it. You control the first two.
- How big you go. Power your home uses as the panels make it is worth the full retail price. Power you send to the grid earns about a quarter of that. So the panels that pay best are the ones your own home can absorb, and every panel past that point earns a quarter as much.
- What you pay for the install. Compare quotes per watt: the price divided by the system's size in watts.
- Your roof. Which way it faces and how much shade falls on it decide how much a system makes. Two of our homes had systems the same size: the better-aimed roof made 44% more electricity.
- Your rate. Going solar moves you onto PG&E's time-of-use plan, which averages 32.6¢ a kWh against the 38.0¢ you would pay on the standard plan. So each unit your panels offset saves you about 14% less than it would have, which adds more than a year to payback (more below).
The best design for a California roof
Size is measured against the electricity you use in a year, and for a typical PG&E home the fastest payback came from the smallest system we tried:
- Half your usage — about $6,200 at a good price. Pays for itself in 7.5 years and returns 14.1% a year.
- All of your usage — about $13,600. Pays back in about 10½ years: three years slower than the half-size system.
- More than your usage — at 120% of it, payback stretches to 11.5 years, because the surplus is sold to the grid at a quarter price.
Whatever the size, the rules are the same:
- Best faces first. South beats east and west; north faces get the least sun of all. Google's roof data ranks every possible panel position by the sun it gets, and a good design fills the best ones first.
- Keep panels out of shade. The most shaded roof we modelled lost nearly two-fifths of its sunlight, so it needed half again as much hardware to cover the same usage.
- No battery, unless you want backup power.
See the best layout for your own roof, free →
Does a battery make sense?
For savings, not yet. None of the five batteries we priced paid for itself on any of the 56 homes. The cheapest, about $8,500 installed, saves about $458 a year by storing midday solar for the evening: 18.6 years to pay back, and it will need replacing before then.
When it can make sense:
- Backup. If power shutoffs are a real problem where you live, a battery keeps the lights on. That is worth something we did not put a price on, so buy one for that reason, not for the savings.
- SGIP equity rebates. California's larger battery rebates, around $1,000 per kWh of storage, do make it pay, but they generally require a high fire-threat area and a low income or medical need.
What changed in 2023
On 15 April 2023 California changed how solar pays. The new rules are known as NEM 3.0 (officially the Net Billing Tariff).
- Solar you use at home is still worth full price: it is electricity you no longer buy.
- Solar you send to the grid now earns about a quarter of what it used to.
- The cost: about four more years to break even. The same homes would pay back in 6.4 years under the old rules; under the new ones it is 10.4.
- Already had solar before April 2023? You keep the old deal for 20 years.
The rate PG&E moves you to
Going solar also changes your rate. PG&E automatically moves new solar customers onto E-ELEC, a time-of-use plan. You don't get to choose.
- It is cheaper on average: 32.6¢ a kWh, against 38.0¢ on the standard plan.
- But it is most expensive from 4 to 9pm, up to 55.2¢, just as your panels stop producing.
- So each unit your panels save you is worth about 14% less. That adds more than a year to payback, and no installer's quote will show it.
Is a 9% return good?
It is money you stop paying rather than income, so it is not taxed.
| Solar, half-size system | 14.1% a year, tax-free |
|---|---|
| Solar, full-size system | 9.3% a year, tax-free about 11% before tax |
| Stock market, long run | about 10% a year before tax, with some bad years |
| 25-year tax-free municipal bond | about 4.5% a year |
Solid, not spectacular.
Three sales pitches, checked
Your bill is huge, so solar is a slam dunk.
What we found: a bigger bill buys a bigger system, not a faster payback. Across a 3.5-fold range of usage the payback moved only from 10.4 to 10.8 years, while the 25-year saving went from $16,822 to $56,594.
Finance it and the savings cover the payment.
What we found: on a 15-year loan at 7% with 10% down, the typical home pays $110 a month and saves $94. That is about $16 a month out of your pocket for 15 years. Every home still comes out ahead, just later: payback stretches to about 15 years.
Solar isn't worth it since NEM 3.0.
What we found: it is slower, not dead. At a good price every home broke even within 25 years, and 24 of the 56 cleared our bar for a good investment: payback within ten years and more than $15,000 saved.
Before you sign: six checks
- Check who your utility is. Sacramento, Palo Alto, Santa Clara, Alameda, Redding, Modesto and Turlock run their own, and most still pay full price for power you export. These numbers are for PG&E customers.
- Get at least three quotes, and compare them per watt: the price divided by the system's size in watts. For PG&E customers, $3.10 a watt is a good price: the best-priced quarter of buyers paid that or less last year. The typical buyer paid $3.97.
- Size it to your usage, not your roof.
- Treat a battery as backup, not an investment, unless you qualify for SGIP's equity rebate.
- If you finance, compare the monthly payment with your monthly savings, not the 25-year total.
- Replace an old roof first. Taking the panels off and putting them back later can wipe out the savings.
The fine print
- Who is behind this, and how do you make money?
- SIA is independent, and we do not sell leads or anyone's details. If your numbers are good and you ask us for an introduction, the installer pays us a flat fee and up to $500 of it comes back to you. That is the only way we earn anything.
- Does this include the 30% federal tax credit?
- No. That credit ended for systems paid for after 31 December 2025, so every number here assumes no federal credit at all.
- What about PG&E's monthly fixed charge?
- You pay it with or without solar ($24.12 a month in our data), so solar cannot reduce it. Our savings figures already leave it out.
- Why is our price higher than EnergySage’s?
- EnergySage reports what installers quote shoppers on its marketplace: $2.52 a watt in California this month. We use what homeowners actually paid, from the state’s own records: $3.00–3.10 for the best-priced quarter of buyers. Quotes run lower because not every quote is signed, loan prices include dealer fees that quote figures typically leave out, and most California quotes include a battery whose built-in inverter is counted as battery cost. Berkeley Lab finds quote-based figures line up with roughly the cheapest fifth of real prices. A quote near $2.52 is a good one; most people pay more.
- I'm with SCE or SDG&E. Does this apply to me?
- The 2023 export rules are the same, but your rates are different, so your numbers will be too. The free calculator uses your own utility's rates.
How we worked it out
We picked 56 homes at random across PG&E territory, from Chico to Bakersfield. For each one we measured the roof from Google's 3-D building data and sunlight maps, laid out the best panels, simulated a year of output with the national laboratory's PVWatts model, and priced it on PG&E's filed rates. Every home was given California's average electricity use, about a $191 monthly bill on the standard plan.
Read the full study, with every figure and caveat →
Jargon decoder: the words on your quote
- NEM 3.0 (Net Billing Tariff)
- California's solar rules since 15 April 2023. Power you send to the grid earns about a quarter of the retail price.
- NEM 2.0
- The old rules, which paid full price for exported power. Homes connected before the change keep them for 20 years.
- E-ELEC
- PG&E's time-of-use plan for solar homes. You are moved onto it automatically.
- Time-of-use
- Electricity that costs more at some hours than others; on E-ELEC, most from 4 to 9pm.
- Payback
- How many years until your savings cover what you paid.
- Return (IRR)
- What the system earns you each year on the money you put in, like an interest rate.
- Net present value (NPV)
- 25 years of savings minus the cost, in today's money. Above zero means it beats leaving the money invested at 5%.
- Price per watt
- A system's price divided by its size in watts. The fair way to compare quotes.
- SGIP
- California's battery rebate. Its largest "equity" payments are for homes in high fire-threat areas that also qualify on income or medical grounds.
- kWh
- A unit of electricity. The average California home uses about 500 a month.
What about your home?
Your roof's direction, its shade and your bill all change the answer.
No phone number, no sales calls.
We ran the SIA calculator (officially the SIA Solar Design Studio) on 56 randomly selected houses across Pacific Gas & Electric's service territory in California. California has some of the best sun and the highest electricity prices in the country. Three years into NEM 3.0, which cut the value of exported power by three-quarters, we wanted to know whether either of those advantages still shows up in the answer.
Companion study: we ran the same method across Ameren territory in Illinois, where the economics rest on a state SREC rather than the rate. It prices systems at a modelled $3.30 a watt, because Illinois publishes no comparable record of what homeowners paid, so compare the two studies' shape rather than their exact paybacks.
The short answer
Twenty-four of fifty-six rate a good investment on the bar our calculator holds a design to — payback inside ten years and more than $15,000 saved over 25. Thirty-two rate marginal and none rates poor. Best payback 9.5 years, median 10.4, worst 14.9. Median saving $94 a month, $25,418 over 25 years. Every roof breaks even inside 25 years, and every one has a positive net present value. That is at $3.10 a watt, what the best-priced quarter of PG&E homeowners actually paid in the last year of state records.
It roughly matches the market after tax. The median roof returns 9.3% a year, tax-free, because it is a bill you stop paying rather than income you declare. That is worth 11.0% before tax at the capital-gains rate — a touch above the S&P 500's long-run average of roughly 10%, and more than double the 4.5% a 25-year municipal bond pays. Solid, not spectacular, and fixed the day you sign.
You do not get to choose the rate. PG&E moves new solar customers onto E-ELEC, a time-of-use plan, automatically. That matters, because E-ELEC averages 32.6¢ against the 38.0¢ tiered rate a non-solar household keeps, so every unit your panels offset is worth less. On the tiered rate these roofs would median 9.2 years and 47 of 56 would rate good. On the rate you actually get, it is 10.4 years and 24.
NEM 3.0 took most of what was there. Exports now earn about a quarter of retail. Against a neighbour who connected before April 2023 — on the same tariff, so this is like for like — that costs 4.0 years of payback, 7.0 points of return and $13,037 of net present value. They are on 6.4 years and 16.3%, and every one of the 56 would have rated good under their rules. They keep those terms for twenty years.
A battery still does not pay for itself. Not on one of the 56, and not at any rebate you can simply apply for — even the most generous general-market SGIP step leaves it $2,145 down. The equity tiers at ~$1,000/kWh do flip it, decisively, but they need a fire-threat district and low income or medical qualification. Two of our 56 sit in a fire district; neither is confirmed to meet the second test.
1. Research question
Is solar a good financial investment for homeowners in PG&E territory, three years into NEM 3.0? We ran the SIA calculator over 56 randomly selected rooftops, designing an optimal layout for each and assessing payback period, monthly and lifetime savings, return on investment and net present value — then re-valued every one under the rule that applied before April 2023, to measure what the change actually cost.
2. Method
We sampled 61 detached houses at random from OpenStreetMap across 17 northern and central Californian cities: four per city, or fewer where OpenStreetMap listed fewer houses with a full street address within three kilometres of the city centre. Antioch and Fresno gave one each, and Bakersfield three. A fixed random seed means anyone can draw the same houses again and check our work. Randomly selecting the homes was necessary to avoid introducing bias into this analysis.
Five were then dropped. Four in Merced are served by Merced Irrigation District, a municipal utility that is not on NEM 3.0 at all, and one roof returned no usable geometry. Municipal utilities matter a great deal here — Sacramento, Palo Alto, Santa Clara, Alameda, Redding, Modesto and Turlock all run their own systems and mostly still offer full retail net metering — so the calculator resolves each address to its actual electric utility rather than assuming. That left 56 homes across 16 cities.
Figure 1. Left: the seventeen cities at their true coordinates, marked by what the utility lookup returned — gold for PG&E, dashed red for Merced, which turned out to be served by its own irrigation district. Twelve of them crowd the Bay, so that corner is enlarged underneath. The coastline is simplified; the dots are not. Right: the sun's track across a full day at six of the sampled homes, on the summer solstice, an equinox and the winter solstice, at each roof's own latitude. The green tick is the direction that roof faces. Concord's faces 289° — west-north-west — and makes 1,170 kWh per kW against Richmond's 1,684 off a nearly identical system.
Under the hood in the SIA calculator: runs for any address you enter.
| Held constant | Value | Source |
|---|---|---|
| Household consumption | 6,036 kWh/yr | California residential average, 503 kWh/month — EIA (2024). Among the lowest of any state |
| Average monthly electric bill | $191 | 503 kWh/month at the E-1 rate below; excludes the $24.12 fixed charge, which solar does not offset |
| Electricity rate | E-ELEC | PG&E Electric Home — the time-of-use plan the Solar Billing Plan enrols new solar customers on: 28.5¢ off-peak, 55.2¢ 4–9pm, 32.6¢ average. Filed tariff via OpenEI URDB. The tiered E-1 rate (flat 38.0¢) is what a non-solar household keeps; section 8 reports the difference |
| Installed cost | $3.10/W | What the best-priced quarter of PG&E homeowners paid for a host-owned, solar-only system on NEM 3.0, June 2025 to May 2026: CA DG Stats interconnection records, 3,126 systems, new-home builders excluded — the calculator's default for a PG&E address when this study was revised (16 September 2026). The $3.97/W median is swept in section 6 |
| Federal tax credit | 0% | Section 25D expired for expenditures after 31 December 2025 |
| Export credit | 25% of retail | NEM 3.0 Net Billing Tariff: exports earn avoided cost. Systems interconnected before 15 April 2023 keep full retail for 20 years |
| State incentive | none | California has no residential SREC. SGIP is storage-only and means-tested, so it is excluded here |
| Maintenance | $34/kW/yr | NREL Annual Technology Baseline, residential PV fixed O&M |
| Escalation / degradation / discount | 2.5% / 0.5% / 5% | Planning assumptions |
Every roof was modelled individually: Google's 3-D building data for plane geometry, per-plane shading measured from Google's annual flux raster, and one NREL PVWatts® simulation per plane at its own tilt and azimuth. Systems were sized to each household's own consumption. Several states cap a system at your own consumption; California does not. But under NEM 3.0 an exported unit is worth a quarter of a used one, so building past your own load is a decision to sell cheap. Median system: 4.4 kW producing 1,524 kWh per kW a year.
What “modelled individually” means
Three of the 56, chosen to span the shading range rather than to flatter the result. The left column is Google's aerial photograph. The right column is the same roof as Google's annual flux raster measures it — one reading of annual sunlight for every 10 cm of roof — with the panels the model actually placed drawn on top.
What the roof looks like
What the model measures
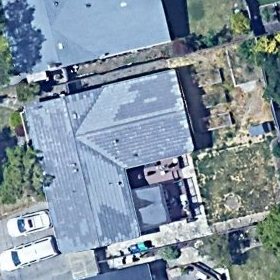
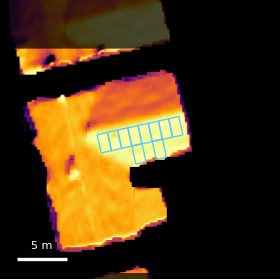
Napa — one plane, open. A single face carrying all ten panels, with almost nothing overhanging it. Mean shade factor 0.89 · 1,551 kWh per kW per year · 4.0 kW.
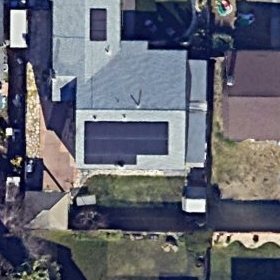
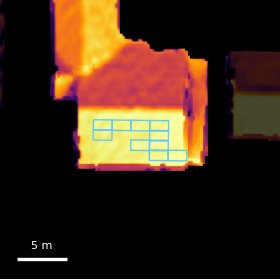
Stockton — the median roof. Slightly better aimed than Napa and slightly more obstructed, which nets out just ahead. Mean shade factor 0.85 · 1,623 kWh per kW per year · 4.0 kW.
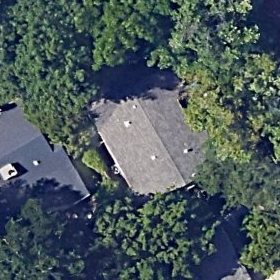
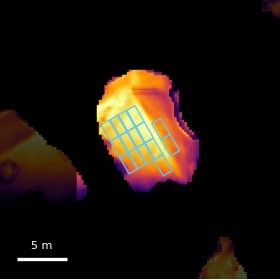
Chico — the worst in the sample. Two planes under heavy canopy, needing 15 panels and 6.0 kW to cover the same load the others do with 10 and 4.0. Mean shade factor 0.62 · 1,011 kWh per kW per year — a third less sun than Fairfield off the same state.
Figure 2. Each frame is 28 m across; the scale bar is 5 m. Faded roofs are the neighbours'. The shade factor is the measured flux divided by what an unshaded plane at the same tilt and azimuth would make, so 0.62 means this roof loses nearly two-fifths of its sunlight to obstruction. A dark plane is not automatically a shaded one — a north face is dark because of where it points. Homes are identified by city only.
Under the hood in the SIA calculator: measured on every roof it models.
Figure 3. One roof taken apart into the planes Google resolved, each drawn at its own bearing, foreshortened by its own pitch and scaled by its own area. Gold planes carry panels; grey ones were resolved and rejected.
Under the hood in the SIA calculator: shown per roof; panels editable plane by plane.
Figure 4. Google returns every position a panel could occupy, ranked by what it would generate; the calculator walks that list and stops when output covers the household's consumption. Under NEM 3.0 that stopping point is a financial decision rather than a legal one — every panel past it sells at a quarter of retail.
Under the hood in the SIA calculator: re-walked whenever your usage changes.
Figure 5. Every stage between typing an address and a payback number, and what each produced for the median home in this study.
Under the hood in the SIA calculator: this whole chain, every time.
3. What the model runs on
Figure 6. The load shape behind every number here, for California specifically. Californian households use less than almost any state and peak in the evening, hours after the panels have stopped — which is exactly why NEM 3.0 hurts and why the time-of-use rate does not help.
Under the hood in the SIA calculator: used whenever a battery is modelled.
Figure 7. PG&E's two residential tariffs decoded from the filed period grids. E-1 is flat at 38.0¢. E-ELEC has three genuine periods a day and a 55.2¢ peak from 4pm to 9pm — real time-of-use, unlike many records in the national database.
Under the hood in the SIA calculator: your utility's filed tariff, looked up by address.
Figure 8. One house, two days, everything at once: generation, household load, what a battery does about the gap, and its state of charge. The July surplus is enormous and most of it leaves the house at a quarter of retail. That single fact is the whole of NEM 3.0.
Under the hood in the SIA calculator: all 8,760 hours, free with an account.
4. Results
Figure 9. Tightly clustered, and every one inside fifteen years. The spread is narrow because California's rate is high enough that even a mediocre roof saves real money: returns run 5.2% to 10.5%. But the whole distribution sits later than it would on the tiered rate, and fewer than half the roofs, twenty-four, land inside the ten-year line the calculator treats as good.
Under the hood in the SIA calculator: runs for any address you enter.
| Metric | Worst | Median | Best |
|---|---|---|---|
| Payback period | 14.9 yrs | 10.4 yrs | 9.5 yrs |
| Monthly saving, year 1 | $86 | $94 | $97 |
| Return (IRR) | 5.2% | 9.3% | 10.5% |
| Net present value | $456 | $7,288 | $8,768 |
| 25-year net savings | $17,496 | $25,418 | $27,551 |
Throughout this study a home is judged on the bar the calculator holds a design to, not on whether it merely breaks even: good means payback inside ten years and more than $15,000 saved over 25; marginal means inside fifteen years and more than $5,000; anything else is poor. The worse of the two axes decides.
A 9.3% annual return, tax-free, on an asset bolted to your roof. The S&P 500 has returned roughly 10% a year since 1928 — before tax, and with single years that lost 44%. A 25-year AAA municipal bond, the usual tax-free benchmark, pays about 4.5%.
Figure 10. The median roof, every dollar the model moves over 25 years. There is no rebate and no SREC in California, so nothing softens the outlay — the line climbs on bill savings alone, which is why it is straighter than the Illinois equivalent. The dashed line is the same money discounted at 5%, so where it ends is the net present value.
Under the hood in the SIA calculator: the series behind your payback and NPV.
5. What NEM 3.0 cost
On 15 April 2023 California replaced net metering with the Net Billing Tariff. Exports stopped earning the retail rate and started earning avoided cost, which works out around a quarter of retail. Anyone connected before that date keeps the old terms for twenty years. We valued the same 56 roofs both ways.
Figure 11. Same roofs, same prices, same installer quotes, and both bars on E-ELEC — only the export rule differs. NEM 2.0 also required a time-of-use rate, so holding the tariff fixed is what makes this like for like. NEM 3.0 costs 4.0 years of payback, 7.0 points of annual return and $13,037 of net present value on the median house. Under the old rule every one of the 56 would have rated a good investment; today twenty-four do.
Under the hood in the SIA calculator: export rules resolve by address, so you see your state's rule rather than a national assumption.
6. What you pay is the part you control
Every number above assumes $3.10 per watt, what the best-priced quarter of PG&E homeowners actually paid for a solar-only system in the twelve months to May 2026. It comes from the state's own interconnection records, 3,126 systems, leaving out solar that builders put on new homes, and it was the calculator's default for a PG&E address when this study was revised. The typical buyer paid more: the median was $3.97, over a quarter more. Both figures are what homeowners reported, including dealer fees on financed systems, so a cash buyer who shops around can pay less than either.
| Installed price | Median payback | Median return | Median NPV | Verdict |
|---|---|---|---|---|
| $3.10/W — best-priced quarter of PG&E buyers | 10.4 yrs | 9.3% | $7,288 | 24 good, 32 marginal, 0 poor |
| $3.97/W — typical PG&E buyer | 12.9 yrs | 6.7% | $3,502 | 0 good, 53 marginal, 3 poor |
That is a 2.5-year swing from the quote alone — about three-fifths of what NEM 3.0 cost, and unlike NEM 3.0 it is entirely within your control. It is also the difference between a market where more than two roofs in five are a good investment and one where none are. The most valuable thing a Californian homeowner can do before signing is get a second and third quote. The most valuable thing an installer can do is not tell you that.
Under the hood in the SIA calculator: the price per watt is an editable field, prefilled with what the best-priced quarter of buyers on your utility paid, with the typical price beside it.
If you do not have $13,640 in cash
A 10% deposit at 7% over fifteen years means a median $1,364 down and a $110 monthly payment, against a median first-year bill saving of $94. That is a net $16 a month out of pocket, every month for fifteen years. On none of the 56 do the savings quite cover the payment from month one. Median payback stretches to 15.2 years and the 25-year position falls to $18,209, the difference being the interest; every one of the 56 still comes out ahead eventually.
$16 a month is a small gap by the standards of most of the country, and that is a consequence of California's rate. But it is a gap, not the free ride a financed quote is often described as, and it runs for fifteen years. If that monthly figure is comfortable the leverage works for you; if it is not, the leverage is the part that hurts.
Under the hood in the SIA calculator: the loan panel shows the net monthly figure directly, and withholds a rate of return when the cash flows cannot support a meaningful one.
7. How much does your bill matter?
Everything above holds the household at California's average, 6,036 kWh a year. That is the state's all-residential average and it includes apartments, so a detached house — which is all this study sampled — will typically sit above it. NREL's ResStock puts the California detached stock nearer 10,000 kWh, though its modelled level runs high against metered EIA totals. Rather than pick a side, we re-ran the study across the range, re-sizing the array for each household the way the calculator does.
Figure 12. The bill barely touches the payback period. Across a 3.5-fold range of consumption the median moves from 10.4 years to 10.8, while the 25-year saving more than triples, from $16,822 to $56,594. A larger household does not get a better deal; it gets a bigger one. That is why holding consumption constant for the main sample is safe, and it means a reader above the average can take the headline timeline and scale the money to their own bill.
Under the hood in the SIA calculator: enter your usage or a monthly bill and the array re-sizes.
The size of the array matters a great deal more
That is the question worth asking instead. Under NEM 3.0 a kilowatt-hour used in the house is worth 38.0¢ and the same one exported is worth about 9.5¢, so every panel past the point your own load can absorb is being paid a quarter price. We held the household at the state average and varied only the array.
Figure 13. A system covering half the household's consumption breaks even in 7.5 years and returns 14.1%; one sized to full offset takes 10.6 years and returns 9.1%. Payback lengthens with every step up in size, so the fastest return may lie below half. Net present value is flat between half and 70% of consumption ($7,951 against $7,980, the circled point) and falls after that, to $7,072 at full offset and $6,077 at 120%. The 25-year total does keep climbing with size, from $21,211 to $25,806, so a bigger array is not wrong; it is a different trade. But an installer sizing you to 120% of your usage under NEM 3.0 is selling you panels earning a quarter of what the first ones do.
Under the hood in the SIA calculator: the size is yours to override, plane by plane.
8. The rate you do not get to choose
Everything above is priced on E-ELEC, and that is not a choice. PG&E's Solar Billing Plan states that residential customers are automatically enrolled in the Electric Home plan — E-ELEC, a time-of-use rate with a 55.2¢ peak between 4pm and 9pm and 28.5¢ off-peak. A household that does not go solar keeps the tiered E-1 rate at a flat 38.0¢. So going solar changes two things at once: how your exports are paid, and what your own consumption is worth.
Figure 14. The arithmetic is not subtle. E-ELEC averages 32.6¢ against E-1's 38.0¢, so every unit your panels offset is worth about 14% less than it would have been. The 55.2¢ peak would repay that if you generated into it, and you do not: panels finish before four. On the tiered rate these roofs would median 9.2 years with 47 of 56 rating good; on the rate solar puts you on it is 10.4 years and 24. That 1.2-year gap is the tariff, not the roof, and no installer quote will show it to you.
9. Batteries: still no, even here
This is the result we expected to come out the other way. Under NEM 3.0 a unit kept at home is worth 38.0¢ and the same unit exported is worth about 9.5¢, so storage finally has a real job. Under the full retail netting California left behind there was nothing to arbitrage at all. It is still not enough.
Figure 15. The gap is not close. A battery that shifts 1,513 kWh a year into the house saves $419 on E-1 and $458 on the time-of-use rate — the tariff switch is worth about 9%, not the doubling people assume. Against $8,500 installed that is 18.6 years undiscounted, and the battery will need replacing before then. None of the five batteries in our catalogue paid for itself on any of the 56 homes.
Under the hood in the SIA calculator: batteries are dispatched hour by hour against your state's load shape, on both your current tariff and the time-of-use alternative.
That is a statement about money, not about batteries. Backup through a public safety power shutoff is a real benefit and this study does not price it. If you want one for that reason, buy it for that reason.
So the honest headline is "California works, if you buy it right"
The sunshine is genuinely better and the electricity is genuinely dearer, and between them they absorb a policy cut that would have sunk a weaker market. Every roof we drew came out ahead at a good price. But the gap between what the best-priced quarter of PG&E buyers paid and what the typical one paid is worth about three-fifths of the policy change everyone is talking about, and it is the one variable here the homeowner decides.
10. Limitations
- Fifty-six homes across sixteen cities describes a distribution. It is not enough to compare cities against one another.
- Roof condition is not modelled. A roof needing replacement in eight years adds a removal-and-reinstall cost that can invert any verdict here.
- Consumption is held at the state average. Californian households vary enormously — a home with air conditioning in Fresno and one in Berkeley are not the same problem.
- E-1 is PG&E's baseline residential rate. Households far above baseline allowance pay more, which would improve these numbers; the study does not model tiering.
- SGIP could change the battery answer for a household that qualifies. It is means-tested and equipment-specific, so we have left it out rather than assume it.
- These numbers are for a system energised now. Anything interconnected before 15 April 2023 is on NEM 2.0 and keeps it for twenty years.
- Installed prices are what homeowners reported on their interconnection applications. They include dealer fees on financed systems, and one price per watt is applied to every system size, although small systems cost a little more per watt.
- Revised 16 September 2026. The first version priced every system at $3.20/W, a DOE modelled price scaled by California electricians' wages, with the $4.23/W Tracking the Sun median for 2023–24 as the sensitivity. State records of what PG&E homeowners actually paid in the last year are newer and specific to this territory; moving to them shortened the median payback from 10.8 to 10.4 years and raised the roofs rating good from 13 to 24.
- Modelled production carries the usual PVWatts uncertainty, and shading is measured from imagery rather than surveyed on the roof.
11. Check it yourself
Every number here came from the free calculator on this site, running public data: NREL PVWatts® for production, Google Solar for roof geometry and shading, OpenEI URDB for the PG&E tariffs, and EIA for consumption. The full methodology documents every model, default and data source, with citations. The municipal bond yield quoted in the summary is the approximate 25-year AAA tax-free yield to maturity, FMSbonds, 7 September 2026.
The dataset is archived alongside the model: the 61 homes as sampled, all 56 valued under three regimes and two price bases, every held-constant input with its source, and the scripts that produced them — with the commit the model was at when it ran.
The point of publishing the method is that you should not have to trust the conclusion. Put your own address in and see whether your roof looks like the median one. No phone number, no sales call, and if the numbers do not work at your address we will say so.
Same method, different market: Is solar worth it in Illinois?
Study run 8 September 2026. 61 homes sampled with seed 20260908; 56 in PG&E territory after utility resolution. Informational estimates, not installation quotes.
Your next move
Two ways to go from here
Do it yourself
Run the numbers on your roof
Check your own home in 30 seconds, or open the full Solar Design Studio and take the wheel — move panels, edit rates, add a battery, model your exact loads. Same engine, every dial in your hands.
White-glove · free
Get a report handmade for you
A former solar-energy scientist hand-builds you a full written analysis of your home — roof, shade, real rates, every lifestyle — plus an optional, low-pressure chat about going solar if you want one. No sales pitch, no obligation, and we never sell your details.
Request my free reportIndependent. Not affiliated with any solar company. We equip you and support you whenever you ask for it.
Read next
The same method across Ameren territory in Illinois, where the economics rest on a state SREC rather than the electricity rate — and leases and PPAs now lose money.
Is solar worth it in Illinois? →