
Want this analysis for your own home?
Built by hand by SIA’s founder, an ex‑solar‑energy scientist.
Email your address and you’ll get a ~25‑page report within one business day:
- Your best system, with and without a battery
- Payback and 25‑yr savings — cash, loan, lease, PPA
- Every incentive that applies to you, your real shading, and what moves the numbers
See a real example (PDF) · Learn more
- Free, no sales calls, and an honest verdict.
Opens your email app.
Your details go to our inbox only — never sold or shared. Privacy policy
Is solar worth it in Illinois? We modelled 46 real homes to find out
We modelled 46 real homes across Ameren's territory in Illinois, roof by roof, to answer one question: is going solar still worth it for homeowners in 2026? Here is what we found, in plain English.
The short answer
Yes, on a roof that gets sun. Twenty of the 46 homes cleared our bar for a good investment and 21 more came out ahead without clearing it. The five that did not are all heavily shaded.
Our three takeaways
Payback
8.1 years
for a half-size system
Half-size means it covers about half the electricity you use. Of every size we tested it paid back the fastest, and the payback got longer the more of your usage the system covered: about 10 years to cover all of it, the most Illinois allows.
Shade
5 of 11
shaded roofs not worth doing
Shade decides it here. In the most shaded quarter of our homes the median payback is 14 years, and five of those eleven never clear the bar. Get your shade measured before you sign.
Illinois Shines
15.8 years
payback without the state's payment
The programme pays a lump sum on 15 years of your projected output, and it carries the whole case: without it not one of the 46 roofs would clear our bar. Its budget is finite.
Your home, your numbers
But is it worth it on your roof?
This study is the average across the homes we modelled. Yours is different — your roof, your shade, your bill, your utility. Run the same model on your own home in about 30 seconds. Free, no account, no phone number.
Check my home free →What makes solar profitable here
Four things decide it, and they are not equal.
- Illinois Shines. The state's payment for the power your roof is projected to make moves the answer more than everything else combined: take it away and the median payback goes from 10.1 years to 15.8.
- What you pay for the install. $3.30 a watt is the Illinois benchmark. Paying the $3.98 the typical US homeowner paid in 2024 instead adds more than three years to payback, and it is the biggest thing on this list you control.
- Your roof. How much shade falls on it, and which way it faces. One home's due-north roof made 827 kWh a year for every kilowatt installed, against 1,360 for a better-aimed roof with a system the same size.
- The 2025 export rule. Power you send to the grid now earns the supply part of the rate only, 11.3¢ against the 21.4¢ you pay. Power you use as you make it is worth double what you export.
The best design for an Illinois roof
Size is measured against the electricity you use in a year. Illinois will not credit a system bigger than that, but a smaller one is allowed, and the choice is a real trade:
- Half your usage — about $10,800 after the smart inverter rebate of $300 a kilowatt. Pays for itself in about 8 years and returns 11% a year.
- All of your usage — about $21,600 after the rebate. Pays back in about 10 years and returns 8% a year, but saves about $7,500 more over 25 years.
- Neither is the wrong choice. Counted in today’s money the two come out about even, so choose by what matters more to you: your money back sooner, or more of it in total. Ask for both sizes priced, because a small system usually costs more per watt.
- A bigger bill means more money, not a faster payback. Across a threefold range of usage the 25-year saving went from $15,400 to $42,100, while payback moved by a year and a half.
- Best faces first, south wins. On one Decatur roof every panel sits within 9° of due south, and the north-facing plane was left empty on purpose.
- Measure the shade. The most shaded roof we modelled lost better than a third of its sunlight to trees.
- No battery, unless you want backup power.
See the best layout for your own roof, free →
Does a battery make sense?
For savings, no. We tested five batteries against all 46 homes and none paid for itself on any of them. The best case still left the household about $14,300 worse off over 25 years.
The reason is how little a battery can earn here: a unit kept at home is worth 21.4¢ against 11.3¢ for one exported, and about 10¢ a unit does not repay a battery inside its warranty. Ameren's rate is also flat through the day, so there is no expensive evening to dodge. Backup power in an outage is a real reason to buy one, about six hours of the essentials, just not a financial one.
What changed for Illinois buyers
- The 30% federal tax credit ended for systems switched on after 31 December 2025. Every number here assumes none of it.
- Exports lost about half their value. Since 1 January 2025 net metering credits the supply part of your bill only, not delivery.
- A smart inverter rebate arrived to soften that: $300 a kilowatt, paid when the system is connected, worth about a year and a half of payback.
- Connected before 2025? You keep full retail netting for the life of the equipment, and a payback nearer 8.4 years.
The rate you pay
Ameren's standard residential rate is close to flat: 21.7¢ a kWh from October to May, 20.6¢ from June to September, the same at every hour of the day. There is no evening peak to dodge, and unlike California, Ameren lets solar customers choose from all of its rate plans rather than moving them onto a time-of-use one.
Is an 8.6% return good?
It is money you stop paying rather than income, so it is not taxed.
| Solar, typical roof | 8.6% a year, tax-free about 10.1% before tax |
|---|---|
| Stock market, long run | about 10% a year before tax, with some bad years |
| 25-year tax-free municipal bond | about 4.5% a year |
Solid, not spectacular. What you give up is liquidity: you cannot sell the panels without selling the house.
Three sales pitches, checked
A lease or a PPA is free solar.
What we found: on these 46 roofs a lease lost the typical household $13,415 over 25 years and a PPA $9,760. One house in 46 came out ahead under either. The federal credit that made those deals work has gone, and the payment is fixed against what your roof generates whatever your exports are now worth. Buying is the only route that clearly works.
Finance it and the savings cover the payment.
What we found: on a 15-year loan at 7% with 10% down, the typical home pays $187 a month and saves $92. That is about $95 a month out of your pocket for 15 years. Payback stretches to 18.2 years, and on four of the 46 the loan never pays back at all.
Your bill is huge, so solar is a slam dunk.
What we found: a bigger bill buys a bigger system, not a faster payback. From 5,000 to 16,000 kWh a year the payback moved from 9.9 to 11.4 years, while the 25-year saving went from $15,400 to $42,100.
Before you sign: six checks
- Check who your utility is. These numbers are for Ameren customers. ComEd in the north, Springfield's city utility and Norris Electric all charge different rates, so their numbers differ — the state's payment and the export rule are the same for all of them.
- Get the shade measured before you sign, not after. It is the one thing that turned homes here from worth doing to not.
- Get at least three quotes, and compare them per watt: the price divided by the system's size in watts. About $3.30 a watt is the Illinois benchmark; the typical US homeowner paid $3.98 in 2024.
- Ask your installer to confirm your Illinois Shines block before you sign. That payment is what makes these numbers work, and the programme's budget is finite.
- Buy it if you can. A lease or a PPA now loses the typical household money.
- Replace an old roof first. Taking the panels off and putting them back later can wipe out the savings.
The fine print
- Who is behind this, and how do you make money?
- SIA is independent, and we do not sell leads or anyone's details. If your numbers are good and you ask us for an introduction, the installer pays us a flat fee and up to $500 of it comes back to you. That is the only way we earn anything.
- Does this include the 30% federal tax credit?
- No. That credit ended for systems paid for after 31 December 2025, so every number here assumes no federal credit at all.
- What about Ameren's monthly fixed charge?
- You pay it with or without solar ($14.01 a month in our data), so solar cannot reduce it. Our savings figures already leave it out.
- I'm with ComEd in northern Illinois. Does this apply to me?
- Illinois Shines and the 2025 export rule are the same statewide, but ComEd's rates are different, so your numbers will be too. The free calculator uses your own utility's rates.
How we worked it out
We picked 46 homes at random across Ameren's Illinois territory, in 13 cities. For each one we measured the roof from Google's 3-D building data and sunlight maps, laid out the best panels, simulated a year of output with the national laboratory's PVWatts model, and priced it on Ameren's filed rates. Every home was given Illinois' average electricity use, about a $148 monthly bill.
Read the full study, with every figure and caveat →
Jargon decoder: the words on your quote
- Illinois Shines (SRECs)
- The state programme that pays you for the clean power your roof is projected to make, as a lump sum based on 15 years of output.
- Smart inverter rebate
- $300 for every kilowatt you install, paid by Ameren when the system is connected.
- Net metering, supply-only
- Since 2025, power you export is credited at the supply part of the rate, not the delivery part: about half of what you pay.
- Payback
- How many years until your savings cover what you paid.
- Return (IRR)
- What the system earns you each year on the money you put in, like an interest rate.
- Net present value (NPV)
- 25 years of savings minus the cost, in today's money. Above zero means it beats leaving the money invested at 5%.
- Price per watt
- A system's price divided by its size in watts. The fair way to compare quotes.
- kWh
- A unit of electricity. The average Illinois home uses about 690 a month.
What about your home?
Your roof's shade, its direction and your bill all change the answer.
No phone number, no sales calls.
We ran the SIA calculator (officially the SIA Solar Design Studio) on 46 randomly selected houses spread across Ameren's entire service territory in Illinois. Two things changed for Illinois buyers inside eighteen months: the federal ITC expired for systems placed in service after 31 December 2025, and net metering stopped crediting delivery charges for anyone connected after 2024. What is left is Illinois Shines and a smart inverter rebate. We wanted to find out whether that is still enough.
The short answer
Thirty-five out of thirty-five. Every house whose roof was not heavily shaded cleared our calculator's bar — no exceptions. Nineteen rate good (payback inside ten years and more than $15,000 saved), sixteen marginal, none poor. Median payback 9.8 years, then fifteen more years of electricity you do not pay for, worth about $25,600. Across all 46 roofs, shaded ones included, 20 rate good and 21 marginal.
Stocks are the wrong benchmark. A solar return is tax-free — it is a bill you stop paying, not income you declare — so it belongs beside the things people actually buy for tax-free income, and there the benchmark is municipal bonds: about 4.5% on a 25-year AAA today. The median roof here returns 8.6% a year. The best quarter returns 9.5% or better. That is near enough double the tax-free alternative, and it is a fair comparison, because both numbers already account for the money you put in. Against equities the honest answer is a tie: 8.6% tax-free is worth 10.1% before tax at the capital-gains rate, and the S&P 500's long-run average is about 10% — assembled from single years that lost 44%. What you give up is liquidity. You cannot sell the panels without selling the house.
The exception is shading, and it is unforgiving. All five roofs we would steer you away from sit in the most-shaded quarter, where the odds collapse: 5 of 11 rate poor and only one rates good. The worst took 17.8 years to break even and still finished $4,649 down. If your roof is under trees, that gap gets measured before you sign or it gets discovered afterwards.
Do not sign a lease or a PPA. On these 46 roofs both now lose the typical household money — a median −$13,415 and −$9,760 over 25 years. The federal credit that made third-party ownership work has expired and your exports lost half their value; the fund's payment did not move. Owning the system is the only route that still clearly works.
The clock is real. Illinois Shines is carrying almost all of this. Take the SREC away and median payback goes from 10.1 years to 15.8, not one roof still rates good, and 32 of the 46 turn poor. It is a state programme with a fixed budget, not a permanent feature. Anyone energised before 2025 kept full retail net metering and better numbers still — an 8.4-year payback, a 10.8% return, and 34 of the 46 rating good rather than 20. That door has already closed once.
1. Research question
Is solar a good financial investment for homeowners in the Ameren territory of Illinois? To answer it we ran the SIA calculator over 46 randomly selected rooftops — the same free tool anyone can point at their own address — designing an optimal layout for each and assessing its payback period, monthly and lifetime savings, return on investment, and net present value.
2. Method
We sampled 54 detached houses at random from OpenStreetMap across 17 central and southern Illinois cities, four per city, using a fixed random seed, so anyone can draw the same 54 houses again and check our work. Randomly selecting the homes was necessary to avoid introducing bias into this analysis.
Eight were then dropped, because the calculator resolves each address to its actual electric utility, and theirs was not Ameren: four in Springfield are served by City Water, Light & Power, a municipal utility charging 10.6¢/kWh — half Ameren's rate — and four near Effingham by Norris Electric Cooperative. That left 46 homes across 13 cities.
Figure 1. Left: the seventeen cities at their true coordinates, marked by what the utility lookup returned — gold for Ameren, dashed red for the four cities served by someone else. The state outline is drawn schematically; the dots are not. Right: the sun's track across a full day at six of the sampled homes, on the summer solstice, an equinox and the winter solstice, with each roof's own latitude. The green tick is the direction that roof faces and the pale band is the half of the sky it can see. This is the geometry the production model integrates hour by hour: the Pekin roof faces due north and catches the arc only at its ends, which is why it makes 827 kWh per kW against Champaign's 1,360 off a nearly identical system.
Under the hood in the SIA calculator: runs for any address you enter.
| Held constant | Value | Source |
|---|---|---|
| Household consumption | 8,316 kWh/yr | Illinois residential average, 693 kWh/month — EIA Form EIA-861 (2024) |
| Average monthly electric bill | $148 | 693 kWh/month at the DS-1 rate below; excludes the $14.01 fixed charge, which solar does not offset |
| Electricity rate | 21.35¢/kWh | Ameren Illinois DS-1 Residential, filed tariff via OpenEI URDB |
| Installed cost | $3.30/W | Illinois modelled benchmark, DOE PVSCB Q1-2025 + BLS labour |
| Federal tax credit | 0% | Section 25D expired for expenditures after 31 December 2025 |
| Illinois Shines SREC | $67.50/MWh | IPA block price, paid as a lump sum on 15 years of projected output |
| Export credit | 53% of retail | 11.326¢/kWh — Ameren's Price to Compare, which is the supply charge plus the transmission service charge. Since 1 January 2025, CEJA credits exports on the supply section only; delivery charges are no longer offset |
| Smart inverter rebate | $300/kW-DC | Paid on interconnection, introduced to offset the loss of delivery credits — Ameren Illinois |
| Maintenance | $34/kW/yr | NLR Annual Technology Baseline, residential PV fixed O&M |
| Escalation / degradation / discount | 2.5% / 0.5% / 5% | Planning assumptions — all three swept in section 4 |
Every roof was modelled individually: Google's 3-D building data for plane geometry, per-plane shading measured from Google's annual flux raster (242 planes sampled; median shade factor 0.95, worst 0.54), and one NLR PVWatts® simulation per plane at its own tilt and azimuth. Systems were sized to roughly offset each home's own consumption, the largest size Illinois net metering credits; section 5 tests smaller ones. Median system: 7.0 kW producing 1,228 kWh per kW per year.
Figure 2. Every stage between typing an address and reading a payback number, with what each produced for the median home in this study. Nothing in the chain is a lookup table of averages: the roof comes from Google's 3-D model of that building, the shading from a raster of that roof, the weather from PVWatts at those coordinates, and the price from the tariff that utility has actually filed.
Under the hood in the SIA calculator: this whole chain, every time.
What “modelled individually” means
Three of the 46, chosen to span the shading range rather than to flatter the result. The left column is Google's aerial photograph. The right column is the same roof as Google's annual flux raster measures it — one reading of annual sunlight for every 10 cm of roof — with the panels our model actually placed drawn on top. Nothing in the right column is an artist's impression; it is the input the financial model in the SIA Solar Design Studio runs on.
What the roof looks like
What the model measures
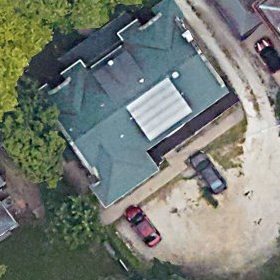
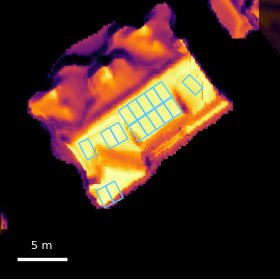
Peoria — open roof, five planes used. Google resolves fifteen separate roof planes here. The model puts panels on five of them, all facing 135–153°, where the raster reads 1,559–1,607 kWh/kW/yr. The north and west faces stay empty. Mean shade factor 0.88 · 1,358 kWh per kW per year · 6.4 kW (16 panels) · payback 7.2 years.
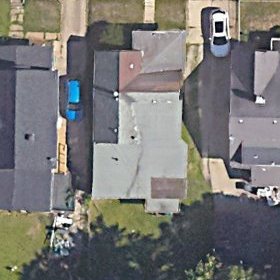
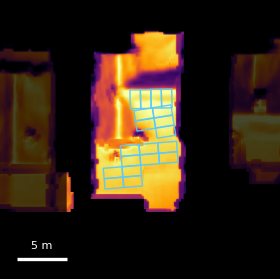
Decatur — nine planes, three used. Every panel sits within 9° of due south. The darkest patch, near the top of the frame, is a steep north-facing plane, and the model placed nothing on it — that darkness is orientation, not shade. Mean shade factor 0.78 · 1,190 kWh per kW per year · 7.6 kW (19 panels) · payback 8.9 years.
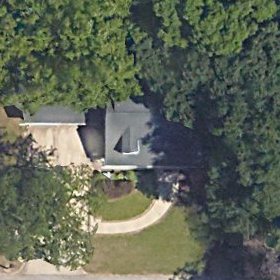
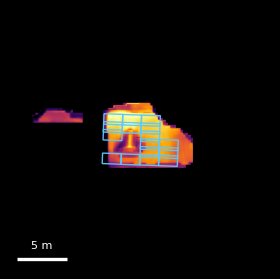
Decatur — one plane, heavy canopy. A single face at 182° and a 41° pitch, reading 1,169 kWh/kW/yr against roughly 1,800 unshaded. The trees take better than a third of it, and the house still breaks even inside eleven years. Mean shade factor 0.64 · 1,052 kWh per kW per year · 6.4 kW (16 panels) · payback 10.7 years.
Figure 3. Each frame is 28 m across; the scale bar is 5 m. Faded roofs are the neighbours' — Google measures the whole scene, and we keep only this building. The shade factor is the measured flux divided by what an unshaded plane at the same tilt and azimuth would make, so 0.64 means this roof loses just over a third of its sunlight to obstruction. Across all 46 homes the mean shade factor runs from 0.62 to 0.89; these three sit at the 2nd, 33rd and 93rd percentiles of that spread, which is what “span the range” means here. A dark plane is not automatically a shaded one — a north face is dark because of where it points.
Under the hood in the SIA calculator: measured on every roof it models.
Figure 4. The same Champaign house the day charts use, separated into the nine planes Google resolved. Four carry panels. A 26 m² plane at 3° is passed over while a 17 m² one at 183° gets three, because bearing beats area — and the 22 m² plane facing 93° gets a single panel only because it is nearly flat, so where it points barely matters.
Under the hood in the SIA calculator: shown per roof; panels editable plane by plane.
Figure 5. Two of the 46. Google returns every position a panel could occupy, ranked by what it would generate; the calculator walks that list and stops when output covers the household's consumption, because Illinois net metering will not credit a system sized past it. The Champaign roof falls away sharply — its later positions are on poorly aimed planes — while Carbondale's two big south faces stay flat for sixteen panels. This is also why payback drifts up as consumption rises in section 6: the extra panels a bigger household needs are the ones further down these curves.
Under the hood in the SIA calculator: re-walked whenever your usage changes.
What the model is actually adding up
Payback is the last step of a long arithmetic, and the inputs to it are worth seeing. A house does not use electricity evenly, a roof does not make it evenly, and the two peaks do not line up. Everything below is the model's own input, not an illustration.
Figure 6. The load shape behind every number in this study, from NLR's ResStock model of Illinois single-family homes, scaled to 8,316 kWh a year. Two things drive the result: demand peaks in the early evening, after the roof has stopped producing, and it peaks again across July and August for air conditioning — which is the one time of year the roof and the house agree.
Under the hood in the SIA calculator: used whenever a battery is modelled.
Figure 7. Ameren's DS-1 is close to flat. Decoding the tariff's own period grids shows the split is seasonal, not time-of-day: 21.7¢ from October through May, 20.6¢ from June through September, identical at every hour and on weekends. There is no evening peak price to dodge, which is a large part of why a battery struggles to pay for itself here. The study priced every home at the 21.35¢ weighted average.
Under the hood in the SIA calculator: your utility's filed tariff, looked up by address.
Figure 8. One house, two days, everything at once. In July the roof makes more than the house can use by mid-morning, the battery fills by early afternoon, and the surplus after that is exported. In January the same roof makes 16 kWh against 28 kWh of demand: the battery never fills, and the evening still has to be bought. Days shown are each month's median for output, not its best. Under full retail net metering the battery is moving kilowatt-hours that were already worth full price either way — which is the argument of section 7, drawn.
Under the hood in the SIA calculator: all 8,760 hours, free with an account.
3. Results
Figure 9. Most break even between eight and eleven years. The long tail is shading and awkward orientation, and it is longer than it used to be: a badly aimed roof exports more of what it makes, and an exported kilowatt-hour is now worth about half a used one.
| Metric | Worst | Median | Best |
|---|---|---|---|
| Payback period | 17.8 yrs | 10.1 yrs | 8.3 yrs |
| Monthly saving, year 1 | $41 | $92 | $101 |
| Return (IRR) | 3.2% | 8.6% | 10.9% |
| Net present value | −$4,649 | $6,633 | $9,064 |
| 25-year net savings | $11,026 | $25,120 | $28,003 |
Throughout this study a home is judged on the same bar the calculator holds a design to, not on whether it merely breaks even: good means payback inside ten years and more than $15,000 saved over 25; marginal means inside fifteen years and more than $5,000; anything else is poor. The worse of the two axes decides, so a quick payback on a tiny system does not pass.
Returns ran from 3.2% to 10.9%, with half the houses between 7.0% and 9.5%. Price, electricity rate and household usage were identical for every home, so that spread is the roof and nothing else. An 8.6% annual return, tax-free, on an asset bolted to your roof. The S&P 500 has returned roughly 10% a year since 1928 — before tax, and with single years that lost 40%.
Figure 10. The same house as the day charts. Payback and net present value are two numbers standing in for this 26-step series, and the shape is the argument: a step up in year one for the smart inverter rebate, a climb for three years while Illinois Shines pays its instalments, then two decades of a smaller bill, rising about 2.5% a year as rates escalate and falling about 0.5% as the panels age. The dashed line is the same money discounted at 5%, so where it ends is the net present value — $6,729 here, against a $25,672 nominal position. The gap between those two lines is what waiting costs.
Under the hood in the SIA calculator: the series behind your payback and NPV.
4. What actually decides it
We re-ran all 46 homes changing one variable at a time. This is the section that matters, because it separates the questions worth asking an installer from the ones that are noise.
Figure 11. Years added to or taken off the 10.1-year median, one variable at a time. Illinois Shines moves the answer more than everything else combined. The price you are quoted comes second: paying the $3.98/W US median for 2024 installs instead of the $3.30 Illinois benchmark costs 3.2 years on its own, and it is the largest item here a homeowner actually controls. The green bar is the rule new buyers no longer get.
Under the hood in the SIA calculator: every one of these is an editable control.
Figure 12. The 46 split into quarters by measured shade. Under the old rules the worst quarter paid back in a median 11.5 years and not one rated poor; today the median is 14.0 years and 5 of the 11 do. Supply-only netting opened that gap, because a badly aimed roof exports a larger share of a smaller output, and exports lost half their value. Roof quality used to be a detail in Illinois. It is not any more.
What each support is actually worth
The tornado ranks the variables; this puts money on them. We re-valued all 46 houses with each support removed in turn, changing nothing else — same roofs, same production, same $3.30/W, same 21.35¢/kWh.
Figure 13. The same 46 houses with each support removed in turn. Illinois Shines carries the result almost single-handed: without it the median goes to 15.8 years, no roof still rates good, and 32 of the 46 turn poor. The smart inverter rebate is worth another 1.5 years. The top bar is what a system energised before 2025 still has, which is the clearest measure of what the 2025 rule change cost a new buyer — 1.7 years of payback and about $5,900 of net present value on the median roof.
Under the hood in the SIA calculator: incentives resolve by address.
5. What your electricity bill actually changes
Consumption enters the model twice: it sets how big a system Illinois lets you build, and it sets how much of your own output you use rather than export. Since 2025 those two are worth different amounts, so both matter.
A bigger household does not install the same system: Illinois lets you size up to your own consumption and no further. So the honest test re-sizes the array for each household rather than holding it fixed, and it separates two things people routinely conflate:
Figure 14. Twenty homes, each re-sized four times. A threefold increase in usage nearly triples the money and moves the payback period by 1.5 years.
Under the hood in the SIA calculator: enter your usage and the array re-sizes.
| Household usage | Median system | Payback | NPV | 25-year net |
|---|---|---|---|---|
| 5,000 kWh/yr | 4.4 kW | 9.9 yrs | $4,327 | $15,439 |
| 8,316 kWh/yr (study baseline) | 7.2 kW | 10.4 yrs | $6,303 | $25,228 |
| 12,000 kWh/yr | 10.4 kW | 10.8 yrs | $8,125 | $34,242 |
| 16,000 kWh/yr | 14.0 kW | 11.4 yrs | $8,237 | $42,096 |
Your bill decides how much there is to win, not whether you win. Triple the usage and the money nearly triples — but the payback period moves by only 1.5 years.
That flatness is what lets us hold consumption at one figure for the main sample without the answer depending on it, and it is just as well, because the figure is conservative. The 8,316 kWh we use is Illinois' all-residential average, which includes apartments and condominiums. This study sampled detached houses, and a detached house uses more — NREL's ResStock puts the Illinois detached stock nearer 12,000 kWh, though its modelled level runs high against metered EIA totals. The band above spans both, and the payback answer moves by half a year across that part of it. A household at 12,000 kWh gets a larger system and about a third more money, on much the same timeline.
The payback drifting up as systems grow is real and worth understanding. Panels are placed on the best roof planes first, so each additional panel on a larger system goes somewhere slightly worse — a shadier plane, a poorer angle. Big systems are still worth building; they simply have a marginal panel that earns less than the first one did.
The interaction is small but no longer absent. Under the full retail netting that applied before 2025 it genuinely vanished — a kilowatt-hour was worth the same whether you burned it or sold it. Supply-only netting brings the question back: a household that uses more of what it makes keeps more of the value, which is part of why the largest systems here pay back slowest.
Smaller than your usage is allowed, and it pays back sooner
Illinois caps a system at your consumption; it does not require you to reach it. Since 2025 the choice pulls both ways. An exported kilowatt-hour earns only the supply part of the rate, which rewards a system small enough for the house to use most of its output. Illinois Shines pays on every kilowatt-hour a system makes, exported or not, and the smart inverter rebate pays per kilowatt, which reward size. We held the household at the state average and varied only the array, taking the best roof positions first as the calculator does.
Figure 15. Twenty homes, each sized four ways for the same 8,316 kWh household. Payback lengthens with every step up, from 8.1 years at half of usage to 10.4 at all of it, while the 25-year saving rises from $17,740 to $25,228. Half-size paid back fastest on all twenty homes, and in 6.8 years on the best roof. Net present value, not plotted, stays between $6,206 and $6,520 at every size.
Under the hood in the SIA calculator: the size is yours to override, plane by plane.
| Array size | Upfront, after rebate | Payback | Return | 25-year net |
|---|---|---|---|---|
| 50% of usage, 3.6 kW | $10,800 | 8.1 yrs | 11.2% | $17,740 |
| 70%, 4.8 kW | $14,400 | 9.0 yrs | 9.9% | $20,815 |
| 85%, 6.0 kW | $18,000 | 9.8 yrs | 9.0% | $23,245 |
| 100%, 7.2 kW | $21,600 | 10.4 yrs | 8.3% | $25,228 |
In Illinois, size is a choice between speed and total. A system covering half your usage pays back 2.3 years sooner and returns 11.2% instead of 8.3%, on half the outlay; one covering all of it saves about $7,500 more over 25 years. Net present value barely moves, so neither is the wrong answer.
That is not how it came out in PG&E territory, where net present value falls by about a tenth between a system covering 70% of usage and one covering all of it. Here it falls by about 3%, because Illinois Shines and the rebate keep paying for the panels a smaller system would leave off. One caution runs the other way: the model prices every size at the same $3.30 a watt, and a small system usually costs more per watt, because permits, design and the inverter do not shrink with the array. A real half-size quote will narrow the payback gap, so ask for both sizes priced.
So the honest headline is not "Illinois roofs are good"
They are ordinary. Illinois yields about 1,228 kWh per kW — less than Arizona, more than Seattle. What makes these numbers work is Illinois Shines, with a smart inverter rebate propping it up. Remove the SRECs and median payback goes from 10.1 to 15.8 years. The other half of the old answer, full retail net metering, has already been withdrawn from new buyers, and that alone cost 1.7 years. Both are policy, one has already been cut here, and neither is guaranteed to last. That is an argument for acting while they exist, not an argument that the roof is special.
6. How you pay changes what you keep
Figure 16. The same 46 roofs, priced four ways. Buying outright leaves the median household $25,120 ahead over 25 years and a loan $12,301. A lease or a PPA now leaves them behind — a median −$13,415 and −$9,760, with one house in 46 ahead under either. Two things did that: the federal credit that made third-party ownership work is gone, and a contract priced off what your roof generates does not care that your exports are now worth half of retail. You carry that; the fund does not.
Under the hood in the SIA calculator: cash, loan, lease and PPA, side by side.
A lease or PPA now does cost the typical household money, which was not true a year ago. It is the clearest single consequence of the two policy changes: the fund's payment is fixed at signing against what your roof generates, while the value of that generation fell when exports stopped earning delivery charges. Whatever is left goes to whoever owns the system. On the median home the fund behind the PPA still earns 21.8% while the household ends up −$9,760 over 25 years. Buying the same roof outright keeps $25,120. The gap is the SRECs and the smart inverter rebate, which follow ownership — and since 25D expired, a third-party owner can still claim a commercial credit that you no longer can.
If you do not have $23,760 in cash
Most people do not, so the loan column is the realistic one. On these 46 roofs a 10% deposit at 7% over fifteen years means a median $2,310 down and a $187 monthly payment, against a median first-year bill saving of $92. That leaves the household about $95 a month out of pocket for fifteen years — roughly $17,000 — before the loan ends and the system runs free for the remaining decade. Median payback is 18.2 years against 10.1 for buying outright, and the 25-year position is $12,301 against $25,120. On four of the 46 the loan never pays back at all inside 25 years.
The number to distrust
Run a financed system through a solar calculator and the payback figure it gives you is often nonsense — ours reported six months for the house above. A loan's running balance crosses zero three times: up in year one when the rebate and the first SREC instalment land against a small deposit, back down around year six once those stop and the payments do not, and up for good only when the loan ends. Report the first crossing and you get six months. The honest number is the last one, and for that house it is twenty-three years. The same applies to the annual return: with payments running through it, a financed system has no single rate of return to quote, so we no longer quote one.
A high-yield savings account is not the right comparison either. $2,310 left in one at 4% becomes about $6,158 over 25 years, against $12,301 here — but the savings account can be emptied on a Tuesday, and this cannot. Financing solar is not an investment of $2,310. It is an investment of $2,310 plus $95 a month for fifteen years, secured on your ability to keep paying it. If that monthly gap is comfortable the leverage works in your favour. If it is not, the leverage is the part that hurts you.
7. Batteries: not yet, and for a specific reason
We tested all five batteries in our catalogue against every home. None paid for itself on any of the 46. The best case still left the household about $14,300 worse off over 25 years. The case for storage has actually improved and is still not enough. Under the old full retail rule an exported kilowatt-hour already earned full price, so storing it gained nothing and lost about 8% to round-trip efficiency. Supply-only netting gives a battery a real job — a kilowatt-hour kept at home is worth 21.4¢ against 11.3¢ sold — but about 10¢ a kilowatt-hour of arbitrage does not repay a battery inside its warranty at today's installed prices.
That is a statement about money, not about batteries. Backup power in an outage is a real reason to buy one, and roughly six hours of essential loads is a real benefit. It is simply not a financial one in Illinois today.
8. Limitations
- Forty-six homes across thirteen cities describes a distribution. It is not enough to compare cities against one another, and you should not read city-level differences into it.
- Roof condition is not modelled. A roof needing replacement in eight years adds a removal-and-reinstall cost that can invert any verdict here.
- The main sample holds consumption at the state average. Section 5 sweeps it, but at four levels across twenty homes rather than continuously across all 46.
- A 25-year horizon outlives most homeownership. Median US tenure is about 12–13 years, and selling early changes the answer.
- Homes were drawn from OpenStreetMap, which may under-represent newer subdivisions with less complete mapping.
- Modelled production carries the usual PVWatts uncertainty, and shading is measured from imagery rather than surveyed on the roof.
- These numbers are for a system energised now. Anything interconnected before 2025 keeps full retail net metering for the life of the equipment, and its economics are the better set shown as the top bar in section 4. We model the new rule, because that is what a reader deciding today would get.
- We model Ameren's DS-1 residential rate. Unlike California — where PG&E moves new solar customers onto a time-of-use plan automatically — Ameren lets net metering customers choose from all five of its rate options as of 1 June 2026, so DS-1 is available to a buyer today. We do not test its time-of-use alternatives, because the time-of-use record for Ameren in our rate database is not trustworthy: it carries a 90.9¢ peak with no hourly variation, which is a data fault we have logged rather than modelled around. A household on a time-of-use plan would get a different answer from the one here.
- The export credit is a single ratio against a single retail rate. Both move: the Price to Compare is reset seasonally, and the delivery side has its own schedule. A homeowner's actual split will differ from 53% by a few points in either direction.
9. Check it yourself
Every number here came from the free calculator on this site, running public data: NLR PVWatts® for production, Google Solar for roof geometry and shading, OpenEI URDB for the Ameren tariff, and the Illinois Power Agency's published block prices for the SRECs. The municipal bond yield quoted in the summary is the approximate 25-year AAA tax-free yield to maturity, FMSbonds, 7 September 2026. The full methodology documents every model, default and data source, with citations.
The dataset is archived alongside the model: the 54 homes as sampled, all 46 valued under five policy regimes, every held-constant input with its source, and the scripts that produced them — with the commit the model was at when it ran, because these numbers only mean anything against a specific version of it. A test suite recomputes every figure quoted on this page from that archive and fails if the page and the data ever disagree.
The point of publishing the method is that you should not have to trust the conclusion. Put your own address in and see whether your roof looks like the median one. No phone number, no sales call, and if the numbers do not work at your address we will say so.
Study run 7 September 2026. 54 homes sampled with seed 20260907; 46 in Ameren Illinois territory after utility resolution. Informational estimates, not installation quotes.
Read next
The same method across Pacific Gas & Electric territory in California, where NEM 3.0 cut the value of exported power by three-quarters and every one of 56 roofs still came out ahead.
Is solar worth it in PG&E territory? →