
Get your free, detailed analysis
Built by hand by SIA’s founder, an ex‑solar‑energy scientist.
Email your address and you’ll get a ~25‑page report within one business day:
- Your best system, with and without a battery
- Payback and 25‑yr savings — cash, loan, lease, PPA
- Every incentive that applies to you, your real shading, and what moves the numbers
See a real example (PDF) · Learn more
- Free, no sales calls, and an honest verdict.
Opens your email app.
Your details go to our inbox only — never sold or shared. Privacy policy
SIA’s Free White Glove Service to Going Solar for Homeowners
How we’re paid. The analysis is free. If you choose to go ahead with an installer we introduce, that installer pays SIA a flat referral fee — the same amount regardless of which installer, system size, price, or financing you pick. It never changes our analysis or who we screen, you pay us nothing, and nothing is shared with any installer unless you ask for an introduction.
What this is. A preliminary, consumer-side solar analysis and planning model — an estimate, not an engineering design, a quote, or a permit document. Production, savings and prices are modeled and not guaranteed, and your results will vary. The installer is responsible for the final engineering, structural and electrical design, equipment compatibility, code compliance, permitting and construction. Screening is not a guarantee of any installer’s work. This is not legal, tax, or investment advice.
Going solar is overwhelming, and that is exactly how most people end up overpaying or stuck with a system that underperforms for 25 years. So take the back seat. One email starts it; one email ends it. In between, you work with one expert who does the analysis, the vetting and the quote-haggling for you — and it is free.
Start with one email. End it with one email. That is the whole commitment.
Buying solar the usual way is miserable
The moment you look into solar, your phone number gets sold to a dozen companies and the calls start. Every quote you get is written to close you. To keep from being oversold, you are expected to learn tariffs, net metering, shading, dealer fees and contract escalators, and to learn them fast. Most people either overpay or give up.
We take all of that off your hands. One email is the only thing you have to do.
What we do for you
-
1
Run the numbers on your actual roof
We measure your roof from satellite imagery and model it on your utility’s real filed rate: production, monthly and 25-year savings, payback, battery or no battery, and a market-price benchmark so you can judge any quote you are handed. It is the same model behind our published studies, built by a former renewable-energy research scientist.
-
2
Give you a straight verdict
Good investment, close call, or not worth it. If solar does not pay at your house, we tell you plainly and we stop there. No one gets sent to an installer on a deal that should not happen.
-
3
Find you one screened installer
We vet every company by hand against public records: active, unrestricted license, real insurance, their own crews, a decade under one name, and no predatory financing. You get one match, and only if you ask for it.
-
4
Hand it over clean
The installer gets your analysis and a right-sized design, so there is nothing left to re-sell you. You deal with one company instead of ten, and you already know the numbers before they say a word.
And we pay you
Up to $500 back, in cash.
You never pay us anything. If you go ahead with the installer we match you to, they pay us a flat finder’s fee, and we share it with you: $100 once you have met the installer, and $400 once your system is switched on.
You stay in charge
We won’t lock you into anything. You decide whether to go solar, and you sign with the installer yourself, not us. Nobody sees your details unless you ask for an introduction. If the answer is no, you keep the analysis and owe us nothing.
Why it is free, and how we are paid
SIA makes money one way. When a homeowner we have helped decides to go ahead, the installer pays us a flat fee for a customer who already understands the deal. We only ever match you with a company we screened before any money was on the table, and the fee is the same flat amount whichever installer it is, so it does not change our verdict. If solar is not right for you, there is no match and no fee, and that is a perfectly good outcome.
A typical solar website sells your details to five or ten contractors at once, and the calls you get afterwards are the product doing its job. We do the opposite. One homeowner, one screened installer, one introduction you asked for.
Send your email and home address to contact@siapolicy.ai. Your electric bill helps but is optional. We never ask for a phone number.
Read next
The longer version: exactly how the free analysis works, and how we vet the one installer we would introduce you to.
Your free analysis, and how installer matching works →This is the actual pipeline that produces your report. Every step runs on your specific address, by hand, by the founder, a former solar-energy research scientist. You are welcome to do it yourself. Most people, once they see what it takes, would rather hand it over.
Jump to any part of the model
Every number here is computed the way your real report is: generation falls when the afternoon tree-shadow crosses the array, the battery charges off midday surplus and discharges into the evening peak, and the bill only ticks up when you actually pull from the grid — priced at the live time-of-use rate. 8,760 hours a year, this is one of them, on a loop.
3-D roof and shade modeling
We pull Google’s Solar building-insights for your roof: LIDAR-derived 3-D geometry, every roof face with its own azimuth, pitch and usable area, and measured sunlight across the surface hour by hour. Nearby trees and neighbouring buildings are in the model, so the shade is measured, not guessed. From that we build the Shade Studio, which plays the real shadows across your roof through the day and through the year, and counts how many panels sit in sun at each moment.
The sun’s path is real for your latitude, and the tree is in the 3-D model. When its shadow crosses the array the shaded panels stop earning and generation drops — which is exactly why we place panels where the sun actually lands, and never pitch cutting the tree.
Each face gets a Total Solar Resource Fraction (TSRF = tilt-and-orientation factor × shade factor), the share of ideal south-facing output it can actually reach. That one number decides which faces are worth using, and whether shading-gated incentives (Massachusetts SMART, for one, needs TSRF ≥ 80%) apply at all.
- Google Solar 3-D
- LIDAR flux
- per-face azimuth / pitch
- hourly shade
- TSRF per face
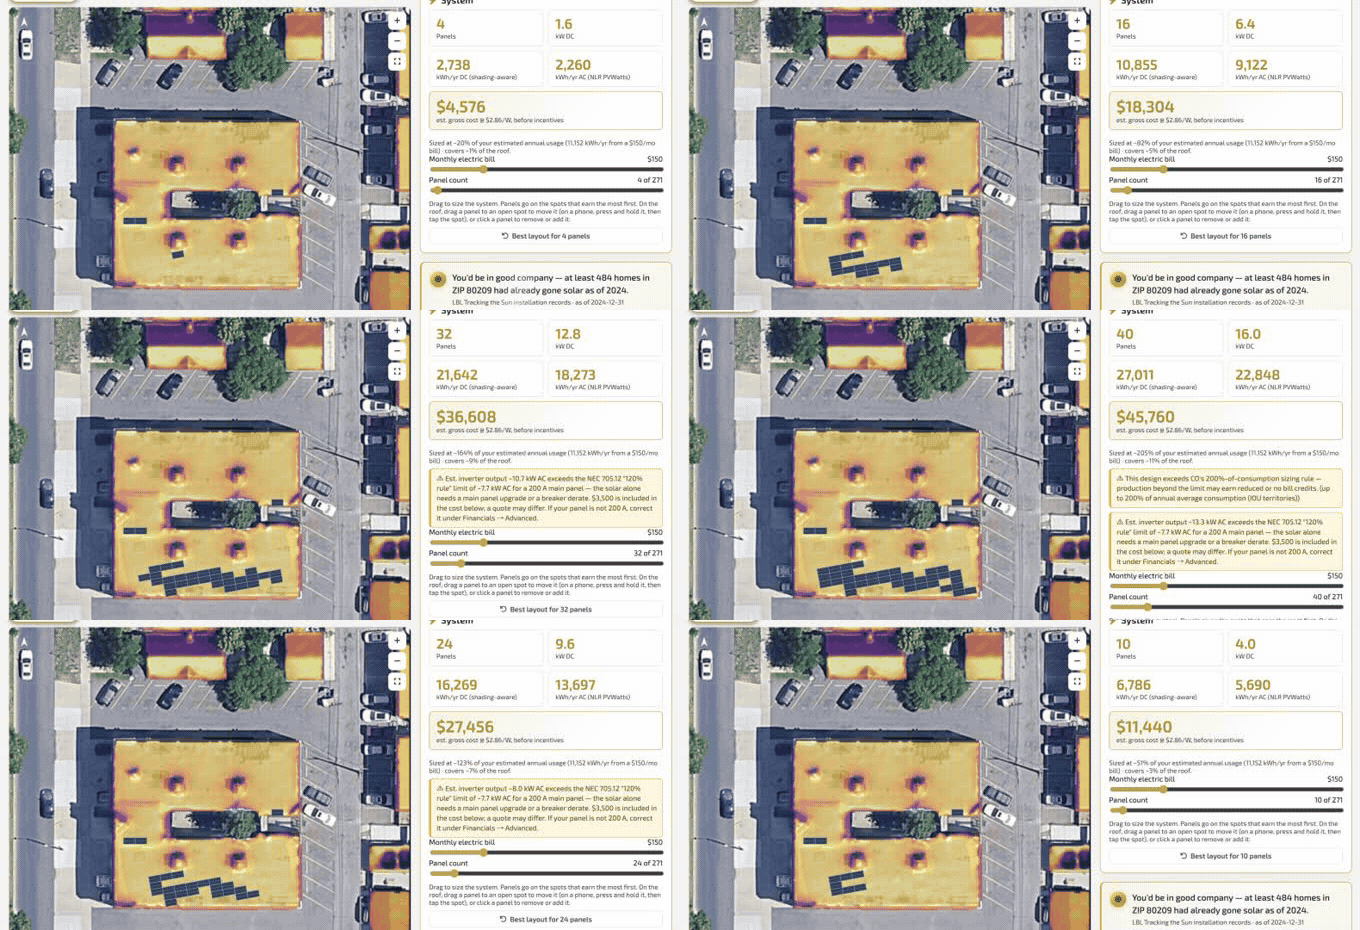
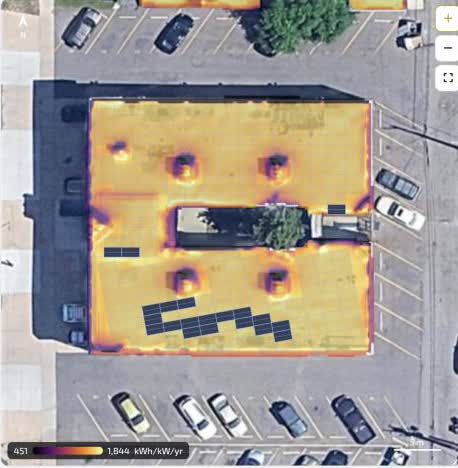
System sizing and roof-segment editing
We lay panels onto each usable face, segment by segment: module count per face, setbacks, row spacing, and the exact faces to use or skip based on their TSRF. We size the array against your actual load, not a round number, and compare module and inverter options, including micro-inverters versus a string inverter, which matters a lot on a multi-face or partly shaded roof where one shaded panel can drag a whole string down.
- per-segment layout
- panel count by face
- setbacks / spacing
- module & inverter choice
- micro vs string
- DC & AC sizing
Production modeling (8,760 hours)
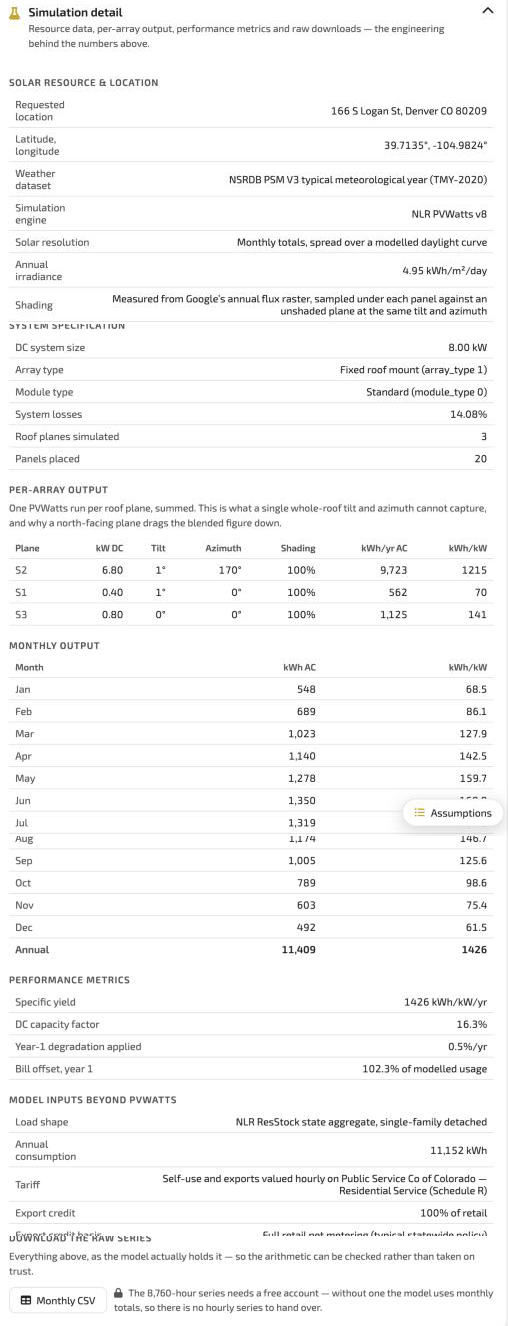
Each array runs through NREL’s PVWatts engine with its own loss figure that encodes the measured shade on that face, so a shaded face produces less, exactly as it would in reality. The output is an 8,760-hour generation profile for the year, not a single annual number, accounting for tilt, orientation, inverter efficiency, the DC-to-AC ratio and system losses.
We model your roof against hourly typical-meteorological-year (TMY) weather data, so a typical cloudy day is cloudy — which is what a battery’s modeled value turns on. A model that assumes every day is identical (left) can’t see the difference. TMY is a representative year, not a forecast; actual weather in any given year will differ.
GPOA is your roof’s measured, shade-aware plane-of-array irradiance, not a regional average · γ ≈ −0.0047/°C · evaluated and summed over all 8,760 hours of the year.
→ 85.9% of the nameplate DC reaches the inverter, which then converts at ≈96% efficiency to the AC your meter sees.
- NREL PVWatts® v8
- per-array shade losses
- 8,760 hourly output
- temp-corrected DC
- inverter clipping
Load modeling
We turn your twelve monthly kWh figures into an 8,760-hour load profile for your home. You can shape it with lifestyle patterns (typical, work-from-home, away during the day, flat) set per month, and layer on the big loads that change the shape: an EV charged at home, electric heating or air-conditioning, a pool pump, an electric water heater. Air-conditioning even swaps the seasonal shape from a winter peak to a summer one. If you have interval data, we can thread your real 8,760 straight through.
Your twelve monthly totals become an 8,760-hour shape. Watch the day reshape as the big loads switch on — an overnight EV block, a broad afternoon AC hump — because when you use power is what decides whether solar and a battery pay. Monthly totals give an estimate; your utility’s actual interval (Green Button) data is the preferred input and can materially sharpen the load and battery economics.
- monthly kWh → 8,760
- 4 lifestyle archetypes
- per-month selection
- EV / HVAC / pool / water heater
- seasonal shaping
- custom interval upload
Rate and tariff modeling
We load your utility’s actual filed tariff and model it the way it really bills, including the rate you would be moved onto when you go solar. Inclining-block (tiered) rates are modeled tier by tier, not flattened to an average, so solar correctly shaves your most expensive kilowatt-hours first. Time-of-use periods, seasonal rates, fixed charges, and the net-metering or net-billing rules that set what your exports are worth are all in the model, and every input is editable. Filed rates are re-synced monthly.
We model inclining-block rates tier by tier, not flattened to an average. That matters: each solar kilowatt-hour cancels your most expensive one first — the 18¢ tier, not the 6.65¢ one — so the savings are bigger than a blended rate would ever show.
- filed URDB tariff
- tier-by-tier blocks
- TOU & seasonal
- fixed charges
- NEM vs net-billing
- export credit
- monthly re-sync
Incentives lookup, with eligibility gates
We check every incentive that could apply to your address, from the DSIRE database (re-synced monthly) plus utility and local programs: state tax credits, upfront rebates, storage incentives, and performance programs. Critically, each one is gated on eligibility, not applied blindly: shading thresholds, income limits, geography, equipment rules. The federal residential credit is modeled at 0%, because it ended for 2026 and later. When an incentive qualifies, it flows into the financials automatically, and you can see and edit every figure.
Every program is gated on your eligibility — shading, income, geography, equipment — before it ever touches your numbers. The federal residential credit is carried at 0% for 2026 and later, because it ended.
- DSIRE + utility + local
- eligibility-gated
- federal ITC 0% (2026+)
- storage & performance programs
- auto-applied, editable
How we price the system
Before you ever talk price with an installer, we give you an estimated reasonable price range for hardware-plus-install in your market, drawn from recent installed prices for your region (the national Tracking-the-Sun dataset and current market data). We show a range, not a single number, and run the modeled profit-and-loss across it — so you have a market benchmark to discuss. Final pricing is set by the installer and depends on your specific site and equipment.
Our modeled market benchmark for this roof is around $2.60/W. Quotes near it are in line with recent market prices; quotes well above our modeled benchmark are worth questioning. This is an estimated reasonable range, not a quote — site conditions, equipment choice and local labor can move it, and the installer sets the final price.
- TTS 2025 + market data
- regional $/W range
- P&L by price
- negotiation target
- before incentives
Financing analysis
We run the same system four ways: cash, loan, lease and PPA. Each gets its own year-by-year cash flow, payback, lifetime savings and return. Loans are modeled with the dealer fee that financing quietly adds, which can inflate the cash price by a fifth or more, so a loan that looks cheaper monthly is compared honestly against cash. Lease and PPA terms, including any annual escalator, are modeled in full, because an escalator buried on a later page is the most common way these deals quietly erase their own savings.
Cash
Loan
Lease
PPA
The same system, four ways. Cash saves the most over 25 years; the loan is cash-flow positive from year one but the dealer fee shows up in its total; the lease and PPA ask nothing up front and give back the least.
- cash / loan / lease / PPA
- dealer-fee modeling
- APR & term
- escalator modeling
- payback / return per option
Battery (storage) dispatch modeling
If a battery is on the table, we dispatch it hour by hour across the full year, against your modeled load and tariff: self-consumption of solar, time-of-use arbitrage where the rate allows it, and backup. This uses a deterministic dispatch heuristic, not a guaranteed-optimal schedule, so actual savings can differ materially. We account for round-trip efficiency, usable depth and degradation, and we sweep sizes to find the one that models best. Often the honest answer is that it does not. On a flat or full-net-metering rate with no time-of-use spread, a battery adds backup but little or no bill savings, and we say so.
We dispatched all five batteries in our catalogue hour by hour against this home’s real load and rate (you just watched one run, up top). The best of them — the Enphase IQ 5P — still leaves you worse off, because this tariff has no time-of-use spread big enough to arbitrage.
We show it anyway, because backup is a real reason to buy one. We just tell you it’s a resilience purchase, not a money one.
- 8,760 dispatch
- self-use / arbitrage / backup
- round-trip & depth
- degradation
- size sweep
- does-it-pencil verdict
Lifetime cash-flow analysis
We project 25 years of cash flow: panel degradation each year, utility-rate escalation, maintenance, an inverter replacement, and your bill with and against solar, side by side. From that come cumulative savings, net present value at a stated discount rate, internal rate of return and payback, for every financing path. The result is a plain verdict: a good investment, a close call, or not worth it, with the numbers behind it.
Good investment, close call, or not worth it — with the numbers behind it. For this Denver roof, buying outright pays for itself in about 18.9 years and nets roughly $15,600 over 25, after everything you pay.
- 25-year horizon
- degradation + escalation
- O&M + inverter swap
- bill with vs without
- NPV / IRR / payback
Full simulation detail and Excel export
Nothing is a black box. A simulation-detail view opens the hour-by-hour dispatch, the monthly bill broken into its components, and the tier-by-tier breakdown of every charge. The whole thing exports to an Excel workbook with the full 8,760-hour series and every line item, so any number in your report can be traced and audited.
| A | B | C | D | E | F | G | |
|---|---|---|---|---|---|---|---|
| # | hour | solar kWh | load kWh | battery kWh | grid kWh | rate ¢ | soc % |
| 1 | Jul-15 06:00 | 0.31 | 0.55 | 0.00 | +0.24 | 5.9 | 18 |
| 2 | Jul-15 08:00 | 1.42 | 0.60 | −0.70 | −0.12 | 5.9 | 41 |
| 3 | Jul-15 10:00 | 2.55 | 0.70 | −1.50 | −0.35 | 5.9 | 78 |
| 4 | Jul-15 12:00 | 3.10 | 0.85 | −1.80 | −0.45 | 5.9 | 96 |
| 5 | Jul-15 14:00 | 2.80 | 0.95 | −1.50 | −0.35 | 5.9 | 100 |
| 6 | Jul-15 16:00 | 1.60 | 1.10 | −0.40 | −0.10 | 10.5 | 100 |
| 7 | Jul-15 17:00 | 0.90 | 1.60 | +0.70 | 0.00 | 10.5 | 87 |
| 8 | Jul-15 18:00 | 0.45 | 2.10 | +1.50 | +0.15 | 10.5 | 58 |
| 9 | Jul-15 19:00 | 0.10 | 2.30 | +2.00 | +0.20 | 10.5 | 21 |
| 10 | Jul-15 20:00 | 0.00 | 1.80 | +1.05 | +0.75 | 10.5 | 3 |
- hourly dispatch view
- monthly bill components
- tier breakdown
- full 8,760 export
- auditable Excel
Validated against your real bills
Before any of it reaches you, we check the model against your actual electric bills. In one recent case the modeled annual bill reconciled to within about 2% of what the homeowner paid — a single example, not a guarantee; accuracy depends on your data and individual results vary. If it does not reconcile, we find out why before we send it, not after.
- reconciled to your bills
- example, not a guarantee
- checked before it ships
The report you get
All of it lands as a roughly 25-page written report you can keep: your roof and shade, the right-sized system, production, every applicable incentive, all four financing paths, the battery verdict, and a market-price benchmark to judge any quote against. Here is a real one.
How we vet your installer
Because you get exactly one introduction, the whole thing rests on that company being good. So the vetting is built to be hard to pass. Every check is done by hand, against public records, before anyone makes the list.
What we check is above. How we score it — the exact thresholds, the data sources, the red-flag patterns we read — stays in-house. That scorecard is the whole reason we can make one honest introduction instead of auctioning your details to ten companies. Every result records the date it was checked and its source. Screening is a point-in-time check against public records, not a guarantee of an installer’s current licensing, insurance, or workmanship.
- licence & discipline
- GL / WC / bond
- 10+ yrs, one name
- own W-2 crews
- no predatory financing
- worst-reviews-first
We sit beside you on the quote
The first quote an installer sends is rarely their best. We do not disappear at the introduction — we read the quote with you, line by line, and hand you the exact words to get it fixed. You advocate; we load the ammunition.
If a screened installer won’t bring the quote to fair, we don’t shrug. We coach you through one more round — and if it still falls short, we introduce you to another screened installer. You are never stuck with a bad deal.
You could learn to do all of this. Or send one email and hand it over.
Request my free analysis