
Want this analysis for your own home?
Built by hand by SIA’s founder, an ex‑solar‑energy scientist.
Email your address and you’ll get a ~25‑page report within one business day:
- Your best system, with and without a battery
- Payback and 25‑yr savings — cash, loan, lease, PPA
- Every incentive that applies to you, your real shading, and what moves the numbers
See a real example (PDF) · Learn more
- Free, no sales calls, and an honest verdict.
Opens your email app.
Your details go to our inbox only — never sold or shared. Privacy policy
Is solar worth it in Massachusetts? We modelled 62 real homes to find out
We modelled 62 real homes across Massachusetts — in Eversource and National Grid territory — roof by roof, to answer one question: is going solar worth it here in 2026, and how much of that is the state's incentives? Here is what we found, in plain English.
The short answer
Yes — and Massachusetts is one of the best places in the country to own a roof right now, because of a stack of policies that will not last forever. Of 62 homes, 61 come out ahead and the typical one pays for itself in about seven years, then keeps paying for nearly two decades more.
Our three takeaways
Payback
7.0 years
for the typical home, then 18 years of profit
The incentives
$3,400 + 0.8 yrs
what SMART (if your roof qualifies) and the credit add
Batteries
0 of 62
homes where a battery paid off
Your home, your numbers
But is it worth it on your roof?
This study is the average across the homes we modelled. Yours is different — your roof, your shade, your bill, your utility. Run the same model on your own home in about 30 seconds. Free, no account, no phone number.
Check my home free →Why Massachusetts is a good place to go solar
- You still get full retail net metering. Every kilowatt-hour your panels send back to the grid is worth exactly what you would have paid for it — about 36¢. California cut that to a quarter of retail in 2023; Massachusetts did not. This one rule is worth more than everything else combined.
- SMART pays you for making power. On top of the bill savings, the state's SMART programme pays roughly 3¢ for every kilowatt-hour your system generates, for twenty years — about $200 a year on the typical roof. The catch: your roof has to clear a shading benchmark (80% TSRF) to qualify, and 44% of the ones we modelled did not.
- A $1,000 state tax credit. Fifteen percent of what you spend, capped at $1,000 — which every real system hits — comes straight off your Massachusetts income tax the first year.
- High electricity prices. At about 30¢ a kilowatt-hour, Massachusetts has some of the priciest power in the country, so every unit your panels offset is worth a lot.
What it looks like without the incentives
- Net metering alone — no SMART, no credit — still pays: 7.9 years, and 61 of 62 homes come out ahead. The incentives are a bonus on a deal that already works.
- But strip net metering too, to the quarter-of-retail export credit California moved to, and payback nearly doubles to 13 years: the typical home’s net present value collapses from about $21,000 to $3,500, and ten fewer roofs stay worth doing (52 of 62 instead of 61).
- That gap — roughly $18,000 of lifetime value on the median roof — is what Massachusetts homeowners have that Californians lost. It is the whole reason to act while the rules still favour you.
See the best layout for your own roof, free →
The best design for a Massachusetts roof
- Build to cover your yearly use. Because a kilowatt-hour is worth the same whether you use it or sell it, you simply size the system to your annual consumption — there is no California-style penalty for a bigger array, up to the 25 kW residential net-metering cap.
- South is best, but east and west are fine. Full net metering means a roof that faces the morning or afternoon still banks everything it makes.
- Shade is the real enemy. The handful of homes that struggled in our sample were heavily shaded or on poor roofs, not in the wrong town.
Does a battery make sense?
- Not for the money — not on one of the 62. Adding a battery subtracted about $15,000 of value on the typical roof.
- The reason is net metering itself: the grid already pays you full retail for what you export, so a battery has almost nothing to arbitrage. It buys you backup power in an outage, which is worth something — but not as an investment.
Is a 15% return good?
| The typical roof here | 14.7% a year, tax-free |
| Worth, before tax | ~17% — a bill you stop paying, not income you declare |
| S&P 500, long-run average | ~10% a year, before tax |
| A 25-year municipal bond | ~4.5% a year |
It is not a jackpot. It is a solid, fixed return that beats the market after tax and is locked in the day you sign — and it is riding on incentives that will not be this generous forever.
Three sales pitches, checked
Solar's a no-brainer in Massachusetts with all the incentives.
Mostly true. 61 of 62 homes came out ahead. But a heavily shaded roof can still take 15+ years — the incentives help a good roof, they do not rescue a bad one. Get the shade measured first.
Add a battery, it'll pay for itself.
False. On none of the 62. Full net metering removes the thing a battery is supposed to earn. Buy one for backup power if you want it, not for the return.
Prices only go up, so lock in now.
The real clock is the incentives. The stronger reason to act is that SMART and full net metering are policy choices the state can change — as California did. Today's terms are generous; they are not promised.
Before you sign: five checks
- Confirm you are on Eversource or National Grid, not a municipal light plant — the municipals do not offer SMART or the same net metering.
- Get a real shade report — not an eyeball. It sets your TSRF, and SMART needs it at 80% or better.
- Get the price per watt in writing. Around $3.10–$3.40 is a good price for an owned system.
- Make sure the quote sizes to your usage, and that SMART and the state credit are both in the numbers.
- Treat a battery as a backup-power purchase, priced separately — not as part of the investment case.
The fine print
- Is there still a federal tax credit?
- No. The 30% residential credit (Section 25D) ended for anything installed after 31 December 2025. Every number here is without it.
- What did you assume I pay for power?
- Each home at its own utility’s current filed rate — about 36¢/kWh on Eversource, 37¢ on National Grid (supply plus every per-kWh delivery charge, excluding the fixed monthly customer charge, which solar cannot offset). If your bill runs higher, solar does better than we show.
- Does this include the fixed monthly charge?
- No — solar does not offset the utility's fixed customer charge, so we leave it out of the savings.
How we worked it out
We drew 62 real houses at random across 17 Massachusetts cities, built each one on the SIA calculator — the same tool you can use free — using Google's 3-D roof model and NLR's PVWatts engine, then valued every roof four ways: with the full stack of incentives, without SMART, without any state help, and stripped to a California-style export credit. Prices are frozen at what the calculator uses for a Massachusetts address.
Read the full study, with every figure and caveat →
What about your home?
Every number here comes from a tool you can run on your own address, free.
No phone number, no sales calls.
We ran the SIA calculator (officially the SIA Solar Design Studio) on 62 randomly selected houses across Eversource and National Grid territory in Massachusetts. Massachusetts pairs some of the highest electricity prices in the country with a policy stack — full retail net metering, the SMART incentive and a state tax credit — that California has already dismantled. We wanted to know what that stack is worth today, and what the same roofs earn once it is stripped away.
Companion study: we ran the same method across Pacific Gas & Electric territory in California, where NEM 3.0 cut export credits to about a quarter of retail. Massachusetts is, in effect, the California of three years ago — which is exactly what the last row of every comparison here shows.
The short answer
Fifty-five of sixty-two rate a good investment on the bar our calculator holds a design to — payback inside ten years and more than $15,000 saved over 25. Six rate marginal and one poor. Best payback 5.4 years, median 7.0, and every roof but one clears a positive net present value. Median saving $209 a month, $61,138 over 25 years. That is at $3.12 a watt, the calculator's modelled Massachusetts price, without the federal tax credit (expired end of 2025), and granting SMART only to the roofs that clear its 80% shading benchmark.
It beats the market after tax. The median roof returns 14.7% a year, tax-free, because it is a bill you stop paying rather than income you declare. That is worth roughly 17% before tax — above the S&P 500's long-run average of about 10%, and several times what a municipal bond pays. Fixed the day you sign.
The incentives are real, and worth capitalising on. SMART and the $1,000 state credit lift a qualifying roof from 7.9 years to about 6.3, adding roughly $3,400 of net present value (SMART worth ~$2,594). But SMART needs a Total Solar Resource Fraction of 80%, and 27 of the 62 roofs fall short — they earn net metering and the credit, no SMART. None of it is promised beyond its term.
But net metering is the foundation. It is worth about $18,000 of lifetime value on the median roof — more than the SMART incentive and the credit combined. Strip it to California's quarter-of-retail export credit and the median roof pays back in 13 years with its net present value cut from $21,232 to $3,554; only 52 of 62 stay worth doing. That is the deal Massachusetts still has and California gave up.
A battery still does not pay for itself. Not on one of the 62. Because full net metering already pays retail for exports, a battery has nothing to arbitrage and subtracts about $14,900 of value on the median roof. Backup power, not an investment.
1. Research question
Is solar a good financial investment for homeowners in Massachusetts, and how much of the answer is the state's incentives? We ran the SIA calculator over 62 randomly selected rooftops, designing an optimal layout for each and assessing payback period, monthly and lifetime savings, return on investment and net present value — then re-valued every one with the incentives peeled back, one layer at a time, down to a California-style export credit, to measure exactly what each layer is worth.
2. Method
We sampled 68 detached houses at random from OpenStreetMap across 17 Massachusetts cities: four per city, drawn with a fixed random seed so anyone can pull the same houses again and check our work. The cities span the state — Worcester, Springfield and Pittsfield in the centre and west; Lowell, Haverhill, Brockton, New Bedford, Fall River and Attleboro around the edges; and a cluster of Greater Boston towns.
Six were then dropped for want of usable roof geometry, leaving 62 homes across 17 cities, all in Eversource or National Grid territory. That boundary matters here: Massachusetts has more than forty municipal light plants — Reading, Wellesley, Concord, Peabody, Braintree, Taunton and the rest — and a house in one of those towns is on a different deal entirely. The municipals do not offer SMART, and their net-metering terms differ, so the calculator resolves each address to its actual utility rather than assuming, and this study is about the two investor-owned utilities only.
Figure 1. Left: the seventeen cities at their true coordinates, gold where the utility lookup returned Eversource or National Grid. The eight Greater Boston towns crowd the east, so that corner is enlarged underneath. The coastline is simplified; the dots are not. Right: the sun's track across a full day at six of the sampled homes, at each roof's own latitude, with the direction the roof faces marked in green. The yield underneath — kilowatt-hours per kilowatt of panel — runs from about 500 on a deeply shaded roof to over 1,400 on an open south-facing one.
Under the hood in the SIA calculator: runs for any address you enter.
| Held constant | Value | Source |
|---|---|---|
| Household consumption | 6,840 kWh/yr | Massachusetts residential average, 570 kWh/month — EIA (2024) |
| Average monthly electric bill | ~$208 | 570 kWh/month at the all-in rate below; excludes the fixed customer charge, which solar does not offset |
| Electricity rate | 36–37¢/kWh | Each home at its own utility's current filed volumetric rate — basic service (supply) plus every per-kWh delivery charge, excluding the fixed monthly customer charge, since that is what an offset kilowatt-hour is worth. Eversource 35.96¢ (MDPU No. 7, Sept 2026: 18.64¢ delivery + 17.32¢ supply); National Grid ~37¢. Taken from the utilities' filed tariffs, not the URDB, whose MA residential records are unreliable. See section 11 |
| Net metering | Full retail | Massachusetts Class I net metering credits exported energy at the full retail rate for residential systems up to 25 kW — the single biggest driver of the result |
| SMART incentive | $0.03/kWh, 20 yrs | Solar Massachusetts Renewable Target, paid on every kilowatt-hour generated, additive to net metering. Requires a shade analysis showing TSRF ≥ 80%; below that this study grants no SMART (section 6) |
| State tax credit | $1,000 | Massachusetts Residential Renewable Energy Income Tax Credit: 15% of cost capped at $1,000, which every real system reaches |
| Federal tax credit | 0% | Section 25D expired for expenditures after 31 December 2025 |
| Installed cost | $3.12/W | The calculator's modelled Massachusetts price (DOE benchmark, labour-adjusted). The $3.42/W U.S. median paid is swept in section 7 |
| Maintenance | $34/kW/yr | NREL Annual Technology Baseline, residential PV fixed O&M |
| Escalation / degradation / discount | 2.5% / 0.5% / 5% | Planning assumptions |
What "modelled individually" means
Each home is not a rule of thumb. The calculator pulls Google's 3-D model of the actual roof, splits it into planes at their real tilt and bearing, measures the sunlight falling on each with an irradiance raster, lays panels best-position-first until the system covers the year's use, runs PVWatts once per plane, then values the result against the rate, net metering, SMART and the credit. Sixty-two roofs, sixty-two separate models.
Three of the 62, chosen to span the shading range rather than to flatter the result. The left column is Google's aerial photograph. The right column is the same roof as Google's annual flux raster measures it — one reading of annual sunlight for every 10 cm of roof — with the panels the model actually placed drawn on top.
What the roof looks like
What the model measures
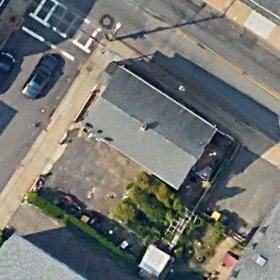
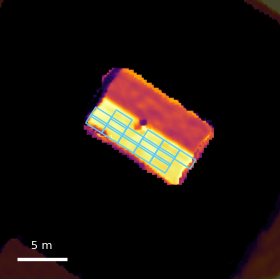
Fall River — open. Mean shade factor 0.83 · 1,285 kWh per kW per year · 5.6 kW, 14 panels on 1 plane.
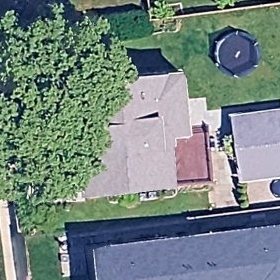
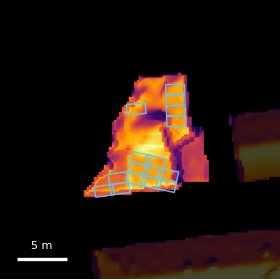
Newton — a typical roof. Mean shade factor 0.87 · 1,088 kWh per kW per year · 6.4 kW, 16 panels on 4 planes.
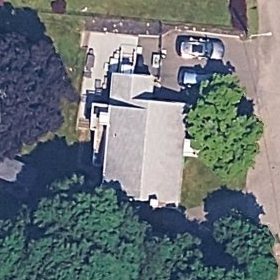
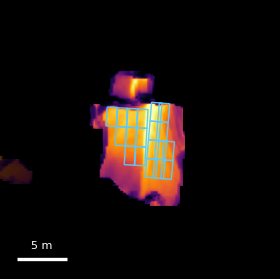
Quincy — shaded. Mean shade factor 0.70 · 872 kWh per kW per year · 7.6 kW, 19 panels on 2 planes.
Figure 2. Each frame is 28 m across; the scale bar is 5 m. Faded roofs are the neighbours'. A dark plane is not automatically a shaded one — a north face is dark because of where it points. Homes are identified by city only.
Under the hood in the SIA calculator: measured on every roof it models.
Figure 3. One sampled roof, broken into the planes Google resolved. Gold planes carry panels; grey ones were resolved but not worth a panel. Each is drawn at its own bearing and foreshortened by its own pitch — the geometry PVWatts integrates for that home.
Figure 4. Every panel position Google finds, ranked by output, with the point the calculator stops. Because Massachusetts pays full retail for exports and SMART on every kilowatt-hour, a panel is worth about the same whether the house uses its output or sends it back — so the system is simply sized to cover the year's own use, then stopped.
Figure 5. Every step between an address and a payback number, with what each produced for the median home — a 6.4 kW system in Newton that pays back in 6.8 years.
Under the hood in the SIA calculator: this is the pipeline it runs on every address.
3. What the model runs on
Two inputs decide the answer as much as the roof does: when the household uses power, and what it pays for it. The first we take from NLR's ResStock model of Massachusetts single-family homes; the second is the all-in rate above. Under full net metering, though, the timing of use barely matters — a kilowatt-hour is worth retail whenever it is made or sold — which is itself the difference from California.
Figure 6. When a Massachusetts home actually uses electricity, month by hour, scaled to 6,840 kWh a year. Winter evenings peak; summer is flatter. In a state with time-of-use export penalties this shape would drive the economics. Under full retail net metering it barely moves them — the annual balance is what counts.
4. The rate — the highest prices in the country
Massachusetts has among the most expensive residential electricity in the United States: about 36¢ a kilowatt-hour on Eversource and 37¢ on National Grid, all-in — more than double the U.S. average. That is the engine behind these returns. Because full retail net metering credits every exported kilowatt-hour at that same rate, each unit your panels make is worth about 36¢ whether you burn it at home or send it back to the grid.
Figure 7. Each utility’s filed all-in residential rate, split into the basic-service supply charge and the total per-kWh delivery charge. Eversource’s components are exact, from its MDPU No. 7 tariff (Sept 2026); National Grid’s basic service is filed and its delivery derived to the ~37¢ it bills. The fixed monthly customer charge is excluded — solar cannot offset it.
We price every home at its own utility’s rate this way, from the filed MDPU tariffs rather than from the OpenEI URDB the calculator normally reads — because the URDB’s Massachusetts residential records are unreliable: National Grid parsed to 43¢, and Eversource’s western rate to a 17¢ delivery-only stub. One documented number per utility is both correct and reproducible.
And here is the quiet advantage over California: Massachusetts residential rates are flat. There is no time-of-use plan a solar customer is moved onto, no 4-to-9pm peak, no penalty for producing at the wrong hour. The hour your panels generate does not change what a kilowatt-hour is worth — only the annual balance does. It is one fewer thing an installer’s quote can get wrong, and one fewer thing the utility can change under you.
5. Results
On the full Massachusetts stack — net metering, SMART and the credit — the median roof pays back in 7.0 years, returns 14.7% a year, saves $61,138 over 25 years and clears a net present value of $24,005. Fifty-five of the 62 rate a good investment; 61 of 62 finish ahead. The eight that lag are shaded or poorly oriented roofs, not homes in the wrong town.
Figure 8. Years to break even across the 62 homes, on the full stack of incentives at $3.12 a watt. The bulk clear inside eight years; the lone home past sixteen is a deeply shaded roof making barely 500 kWh per kilowatt.
Figure 9. The median roof's 25-year cash position. The outlay on day one, softened by the state credit and the first SMART payment; break-even at 6.8 years; SMART payments ending at year 20; and the discounted line ending exactly at the published net present value.
6. What the incentives are worth
This is the question the study was built to answer. We valued the same 62 roofs four ways, changing only the policy, so each layer's contribution is exact.
Figure 10. The same 62 roofs, valued four ways. From the top: the full Massachusetts stack; without SMART; with net metering only; and stripped to a California-style quarter-of-retail export credit. Bars are median payback; the line under each is median return, net present value and 25-year saving.
Read from the bottom up. A California-style export rule would leave the median Massachusetts roof at 13.0 years, a 6.7% return and just a $3,554 net present value — only 52 of 62 worth doing. Full retail net metering is what lifts that to 7.9 years and a $21,232 net present value: worth about $18,000 on the median roof, the single largest lever, and the thing Massachusetts still has.
On top of that, SMART and the $1,000 state credit take a qualifying roof from 7.9 years to about 6.3 and add roughly $3,400 of net present value — SMART worth about $2,594 of it. That is a clear bonus on a deal that already works, and one with an expiry date attached. But SMART comes with a catch, and it is the number the shade report on your roof turns on.
The catch: SMART needs your roof at 80% TSRF
SMART is a production-based incentive — it pays a fixed rate on every kilowatt-hour a system actually generates — but to qualify, a system must clear a shading benchmark: a Total Solar Resource Fraction (TSRF) of 80%. TSRF is the sunlight a roof’s panels actually capture as a share of what an unshaded, ideally tilted array at the same spot would capture; below 80% a system is treated as shaded, and its SMART payments can be reduced or denied. We take the conservative view here: a roof below the line earns no SMART, only net metering and the state credit.
Figure 11. Every roof’s TSRF, against SMART’s 80% line. Twenty-seven of the 62 — 44% — fall short: the western-Massachusetts homes in Springfield and Pittsfield, and shaded roofs scattered through the Boston metro. Their panels still generate and still earn full retail under net metering; they just do not collect the SMART bonus on top.
Under the hood in the SIA calculator: a shade analysis runs on every roof it models.
7. What you pay is the part you control
The policy sets the value of what your roof makes; the installer's price sets what you pay to make it. It is the one number you negotiate. We priced the study at $3.12 a watt, the calculator's modelled Massachusetts figure. The U.S. median that owners actually paid in the last full year of national data is higher, about $3.42 a watt — and at that price the median roof still pays back in about 8 years and still clears a healthy return. A quote much above the mid-$3s, for an owned system, is a quote to negotiate or walk away from.
8. How much does your bill matter?
Less than installers imply. Under full net metering the system is re-sized to each household, so a bigger user simply builds a bigger array — the prize grows, but the payback barely moves.
Figure 12. Twenty-four homes, the array re-sized to four household usage levels. A three-and-a-half-fold range of consumption changes the 25-year saving a great deal and the payback period hardly at all: the bill sets the size of the prize, not the odds.
Figure 13. Holding the household at the Massachusetts average and varying only the array. Unlike California under NEM 3.0 — where value peaks below full offset because exports are underpaid — here the net present value keeps climbing with size, right up to full offset, because an exported kilowatt-hour is worth as much as one used at home. The only ceiling is the roof and the 25 kW cap.
9. Batteries: still no, even here
A battery earns its keep by storing cheap power to avoid buying expensive power — or by holding exports that would otherwise be underpaid. Full retail net metering removes the second job entirely, and Massachusetts has no residential time-of-use penalty to create the first. So there is almost nothing for a battery to arbitrage.
Figure 14. The median roof's net present value, solar alone against solar plus the best-fitting battery. The battery does not add value; it subtracts it. On none of the 62 homes did any battery in our catalogue pay for itself.
This is a verdict about money, not about backup power. A battery keeps your lights on in an outage, and that is worth something to many households. Just do not let it be sold to you as an investment on top of solar — in Massachusetts it is not.
10. So the honest headline is "Massachusetts works — and the clock is the policy"
Nearly every roof we modelled is a good investment today: 61 of 62 finish ahead, the typical one at a 12% tax-free return. That is not because Massachusetts has the best sun — it does not — but because it still pairs high prices with full retail net metering, and stacks SMART and a state credit on top. Take those away and the same roofs are ordinary or worse. The reason to act is not that panels get cheaper or rates rise; it is that the rules making this work are unusually good right now, and other states show they do not stay that way.
11. Limitations
- The rate is each utility's filed volumetric tariff, taken at one point in time. We price every home at its own utility's current all-in per-kWh rate — supply plus all delivery charges, excluding the fixed customer charge (Eversource ~36¢, National Grid ~37¢) — because the OpenEI URDB's MA residential records are unreliable (National Grid parsed to 43¢, Eversource's western rate to a 17¢ delivery-only stub). Basic service resets every February and August, so the supply half is a snapshot; the study uses the current period and escalates it 2.5%/yr. A homeowner on a higher effective rate does better than shown.
- SMART is modelled at a flat $0.03/kWh for 20 years. The real programme's rate steps down over time and varies by utility block and system size; we use a representative residential value. It is additive to net metering, as the programme allows for residential systems.
- Municipal light plants are excluded. Roughly forty Massachusetts towns run their own utilities with different net-metering and no SMART; nothing here applies to them.
- No federal credit. Section 25D expired at the end of 2025 and is not in any number here. If it returns, every payback shortens.
- SMART eligibility is treated as a hard 80% TSRF cut-off. SMART is production-based, so shading already lowers its payment on a per-kWh basis. On top of that we take the conservative view that a system below 80% TSRF earns no SMART at all; if the program instead reduces rather than denies it, the 27 sub-80% homes would do slightly better than shown. TSRF is computed as each roof’s modelled yield over an unshaded, ideally tilted array at the same location.
- Prices are frozen. $3.12/W modelled and $3.42/W paid are point-in-time figures; your quote is your own.
- Weather and degradation are modelled, not guaranteed — PVWatts typical-year weather, 0.5% annual degradation, 2.5% rate escalation.
12. Check it yourself
Every number here comes from a tool you can run on your own roof, free, at the SIA Solar Design Studio. Enter your address, accept the layout it designs or adjust it, and read your own payback, savings and return — with SMART, net metering and the state credit already built in. There is no login to see the numbers and no sales call attached. If you would rather we did it for you, ask for a of your home.
Read next
The same method across Pacific Gas & Electric territory in California, where NEM 3.0 cut export credits to a quarter of retail — the deal Massachusetts still avoids, and the last row of every comparison in this study.
Is solar worth it in California? →