
Want this analysis for your own home?
Built by hand by SIA’s founder, an ex‑solar‑energy scientist.
Email your address and you’ll get a ~25‑page report within one business day:
- Your best system, with and without a battery
- Payback and 25‑yr savings — cash, loan, lease, PPA
- Every incentive that applies to you, your real shading, and what moves the numbers
See a real example (PDF) · Learn more
- Free, no sales calls, and an honest verdict.
Opens your email app.
Your details go to our inbox only — never sold or shared. Privacy policy
Where should homeowners in LA invest their next $10,000?
Short answer: on their roof. On LADWP’s rates, $10,000 of rooftop solar outperforms both the stock market and a new car. Across 50 real LA homes, every system beat the S&P 500 — tax-free — because Los Angeles is the last part of California still on full-retail net metering.
We put $10k of solar on 50 real LA roofs. All 50 beat the stock market — tax-free.
Key takeaways
- We put a $10k solar system on 50 real LA homes on LADWP’s 2026 rates. All 50 beat the S&P 500 — tax-free.
- Returns run 17–23% a year, with a typical ~5-year payback.
- It cuts the bill 50%+ for homes under ~$300/mo, and still saves high users over $1,800 a year.
- This holds only in the City of LA (LADWP) — not SCE or PG&E, which are on NEM 3.0.
- Skip the battery if you’re optimizing for money — it buys backup, not return.
We put a $10,000 solar system on 50 real Los Angeles rooftops and ran it through LADWP’s own 2026 rates. We asked two questions: how much does it cut your bill, and is it a better place for $10k than the stock market?
The short answer
For a homeowner with cash, solar is the best return that $10,000 can buy in LA — and it’s not close. Every one of the 50 homes beat the S&P 500, and the money comes back tax-free.
Why LA is different
When California moved to NEM 3.0 in 2023, it slashed what PG&E and SCE customers get for their solar by about 75%. LADWP never did that. LA runs its own utility, so it’s not under the state commission’s rules — it still pays full retail net metering, crediting the power your panels send back at the same rate you’d pay to buy it. Combined with LADWP’s steep tiered rates (up to 41¢/kWh in summer), that makes rooftop solar dramatically more valuable in the City of LA than a few miles away in SCE territory.
The four things we found
- It cuts your bill most if you’re a moderate user. A $10k system cuts the bill 50% or more for homes under about $300/month, and still saves high users over $1,800 a year.
- It beats the market for everyone. Even the lowest-usage home returned 17% a year — the S&P 500 averages about 10%, and you pay tax on that.
- Stay on the tiered rate. For a solar home without a battery, LADWP’s tiered rate beats its time-of-use rate by $400–$860 a year. Don’t let anyone switch you.
- A battery is not an investment. Adding one subtracts roughly $19,000 from your 25-year result and returns nothing. Buy it for backup if you want backup — not to save money.
Just want a smaller bill?
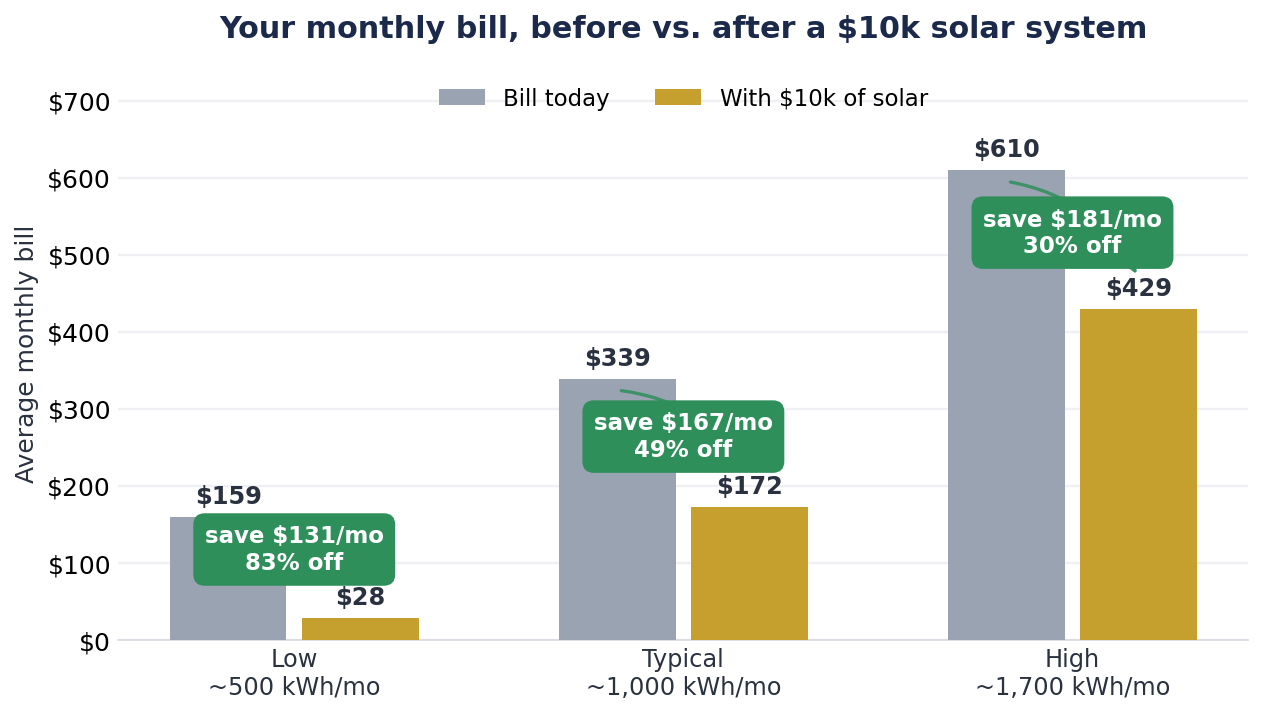
You don’t have to care about returns to care about this: solar works from the day it’s switched on, so your very next bill is smaller. A $10k system knocks ~$130–$180 off every month — for a small bill that’s nearly all of it; for a big one it’s a solid dent, and the worst summer bills fall the most.
Got $10k and the conviction — but not the appetite for the hassle?
Our free white-glove service does the whole thing for you: for free, we design the best system for your roof, make sure you’re not overpaying, and match you with one vetted installer — and we pay you $250 when your system switches on. The hassle-free way to put your $10k into the best investment on this page.
Start my free white-glove analysis How it works →
Free · no sales calls · you stay in charge. Prefer to do it yourself? Run it in the studio.
Want the full method, every chart, and every caveat? Switch to Full study at the top.
1. The question
Most “is solar worth it” articles answer the wrong question for someone who has savings. If you have $10,000 sitting in cash, the real question isn’t just “will solar pay for itself” — it’s “is solar a better place for that $10,000 than the stock market?” And for anyone just trying to tame a brutal LA summer bill, the companion question: how much will a modest system actually knock off?
So we fixed the budget at $10,000 — roughly a 3.6 kW system at LA prices, with no federal tax credit (it expired at the end of 2025) and no LADWP rebate (that program closed in 2018) — and measured what it does across a realistic range of homes.
2. The sample, and an honest note on it
We used 50 real Los Angeles rooftops. Each roof’s shape, tilt, orientation and shading was measured from Google’s solar imagery, and its production was simulated hour-by-hour from local weather — the same engine behind our other California studies.
3. Why LADWP breaks the California script
Three things make the City of LA its own world for solar:
- It’s a municipal utility. The California Public Utilities Commission sets PG&E, SCE and SDG&E rates — but not LADWP’s. So the 2023 NEM 3.0 cut that gutted rooftop economics for the big three never applied to LA.
- Full retail net metering. LADWP’s rules (NEM Rider) credit the energy your panels export at the same retail rate schedule you buy at — not the ~25%-of-retail “avoided cost” the IOUs now pay. One caveat we build in: any net surplus at year-end is not paid out in cash, so there’s no point oversizing past your own usage.
- Steep tiered rates. LADWP charges by how much you use, in tiers. In summer, the top tier (above 1,050 kWh/month) hits 41¢/kWh. Solar shaves your most expensive kilowatt-hours first — so a small system can cut a big chunk of a high bill.
4. The LADWP rate, in one picture
LADWP bills by how much you use, in three tiers that reset each month, and the rates jump in summer. This is the engine of everything that follows — solar erases your most expensive kilowatt-hours first.
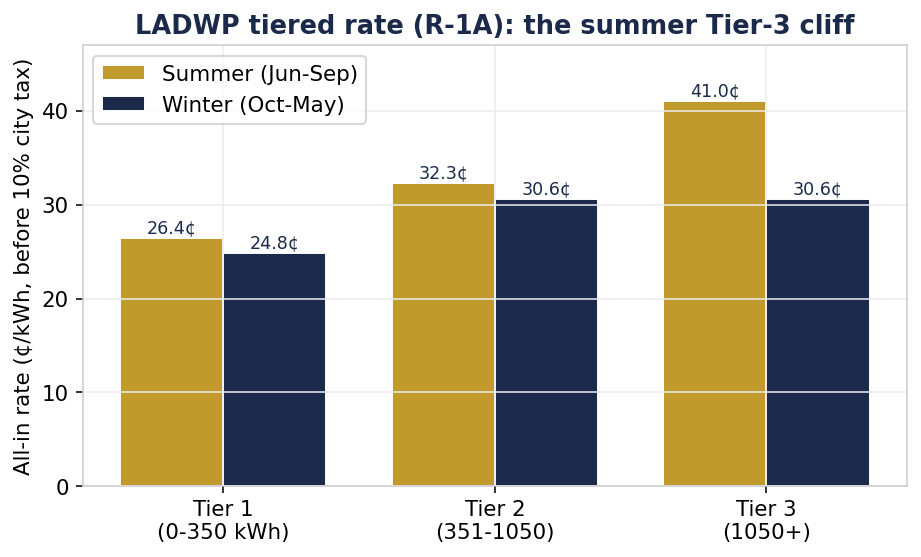
- Three monthly tiers: the first 350 kWh are cheapest, 351–1,050 more, and everything above 1,050 most. Summer (Jun–Sep) is where the top tier spikes to ~41¢; in winter, Tiers 2 and 3 are the same.
- Plus a 10% city tax on energy and a fixed monthly Power Access Charge ($2.30–$22.70 by usage tier) — both are in our model.
- Your rate options: most homes choose the tiered rate (R-1A) or a time-of-use rate (R-1B). The old “pay the lesser of the two” option (Rate C) has been closed to new customers since 2010, and you’re only forced onto TOU if you average above 3,000 kWh/month (very few homes). So it’s a real choice — section 10 shows which to pick.
5. Just want a smaller bill? Here’s what happens in month one
Forget 25-year math for a minute. If all you want is a lower bill, here’s the thing that matters: solar works from the day it’s switched on. Your very next bill is smaller — no waiting, no payback math required to feel it. Here’s what a $10,000 system does to the bill for a low, typical, and high user:
Notice the pattern: the dollars saved are similar for everyone (~$130–$180 a month), because the system makes a fixed amount of power. For a small bill that’s almost the whole thing; for a big bill it’s a solid chunk. Either way, that’s ~$1,600–$2,200 a year you stop sending to LADWP — cash flow you keep from the first month.
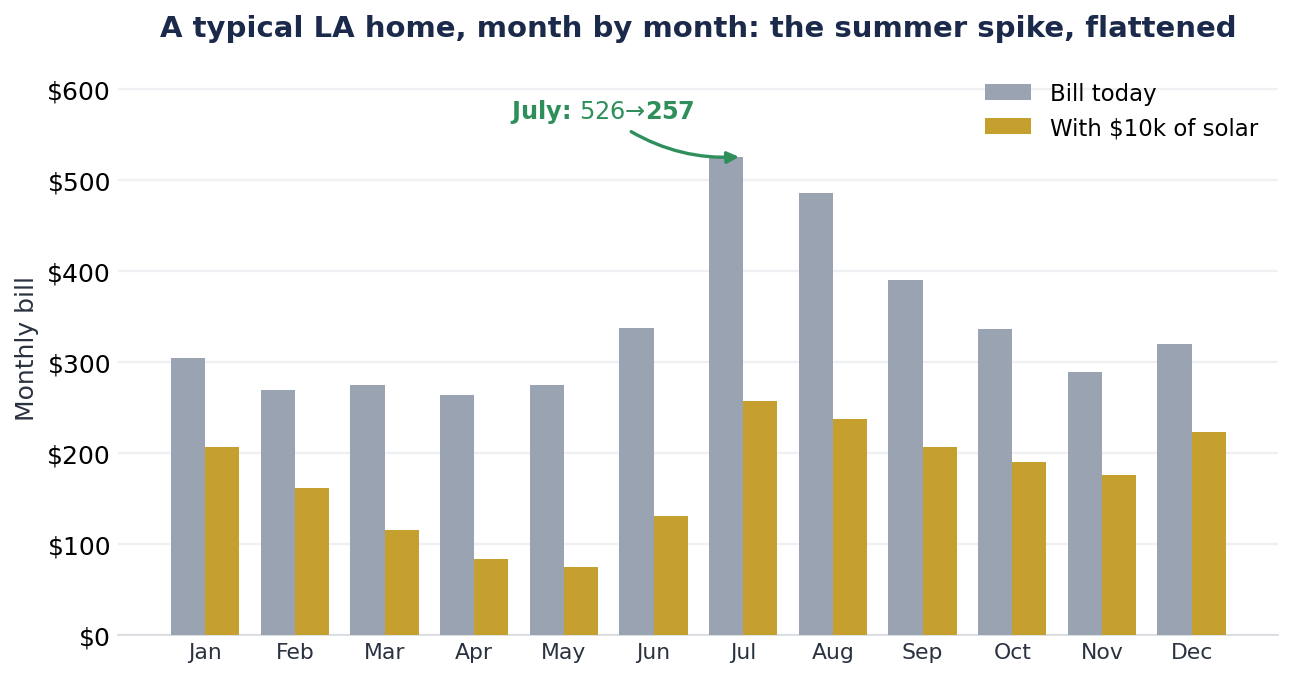
And the summer spike gets flattened
The worst LA bills land in summer, when heavy AC pushes you into that 41¢ top tier. That’s exactly where solar does its best work:
How the cut scales with your usage
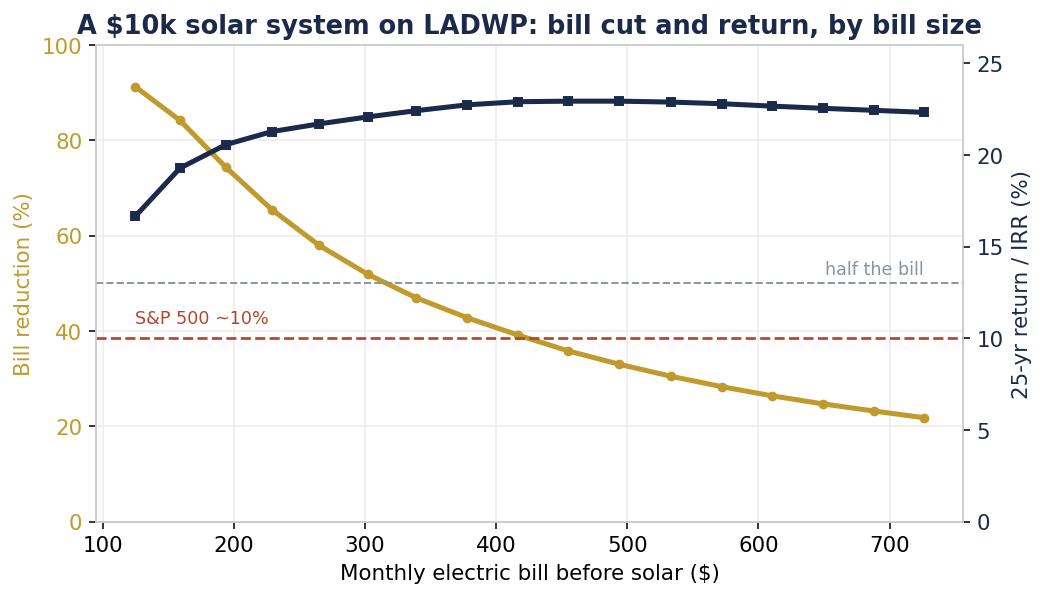
As a share of the bill, the cut is largest for smaller users and tapers for big ones (the system covers a smaller slice of a huge bill) — while the return stays above 20% across the board:
Want to know your exact number — and have someone handle the whole thing for you? That’s our free white-glove service, and we pay you $250 when it’s switched on. More at the end.
6. Does it beat the stock market?
This is the headline. We computed each home’s 25-year internal rate of return (IRR) — the honest apples-to-apples way to compare an investment — net of panel degradation (0.5%/yr), an inverter replacement, and maintenance, with LADWP rates escalating a conservative 4%/year.
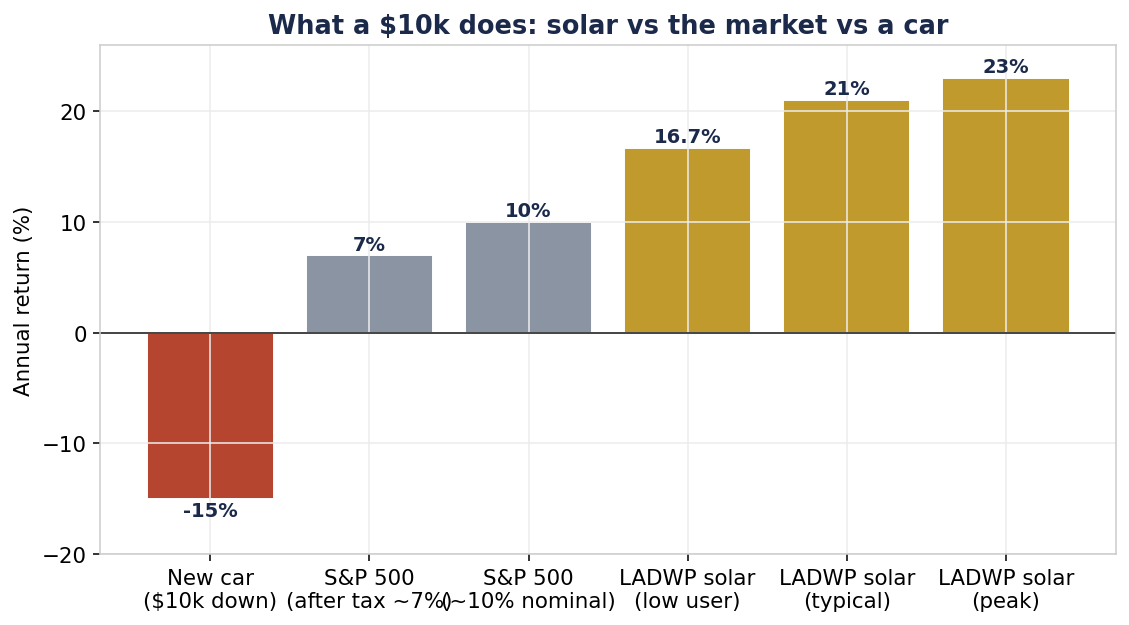
The car comparison, spelled out. It’s the choice a lot of people with $10k in cash actually face. Put it down on a $35,000 car, finance the rest, and five years later the car is worth less than half what you paid — your $10k became equity in a melting asset, a negative ~15%/year. The same $10k on your roof pays you 17–23% a year, tax-free, for 25 years. One depreciates; the other is a power plant.
Every one of the 50 homes returned between 17% and 23% a year. The S&P 500’s long-run average is about 10% — and that’s before tax. Two things sharpen the comparison in solar’s favour:
- Solar savings are tax-free. You don’t pay income or capital-gains tax on a bill you simply never incur. After long-term capital-gains tax, a 10% market return is closer to 7–8.5% in your pocket. Solar’s 17–23% has no such haircut.
- It’s a safer, bond-like return. You’re not betting on the market — you’re locking in savings against a bill that has risen every year. The trade-off: it’s illiquid (tied to the house) and exposed to LADWP changing its rules someday.
And it holds up under pessimistic assumptions. Drop rate escalation to a bare 3%/year and the return is still 18–22%. The conclusion doesn’t depend on optimism.
7. The full sensitivity: price, bill, and size
The one number you control is the price per watt. At LA prices that runs roughly $2.40 (low) to $3.15 (high). Here’s the whole picture for a $10,000 cash purchase — the 25-year net gain and payback, by your bill size and the price you negotiate.
| Your bill before solar | 25-yr net @ $2.40/W | @ $2.75/W | @ $3.15/W | Payback |
|---|---|---|---|---|
| ~$160/mo | +$57,600 | +$54,200 | +$48,700 | 5.5–6.1 yr |
| ~$265/mo | +$72,200 | +$62,900 | +$54,300 | 4.5–5.6 yr |
| ~$360/mo | +$76,600 | +$66,400 | +$57,100 | 4.3–5.4 yr |
| ~$510/mo | +$78,500 | +$67,500 | +$57,500 | 4.2–5.4 yr |
| ~$710/mo | +$76,400 | +$65,200 | +$55,400 | 4.3–5.5 yr |
$10k cash, no loan, no incentives, median across the 50 roofs. A lower $/W buys a bigger system for the same $10k, so it saves more — the price you negotiate swings your 25-year result by roughly $8,000–$20,000. Every cell still crushes the stock market: even the worst (~$48,700 over 25 years on $10k) is a ~16% annual return.
And if you have more (or less) than $10k to put in, here’s how system size and price interact, for a typical 1,000 kWh/month home:
| System size | Up-front ($2.40–$3.15/W) | 25-yr net @ $2.40/W | @ $2.75/W | @ $3.15/W |
|---|---|---|---|---|
| 3 kW | $7,200–$9,450 | +$55,800 | +$54,700 | +$53,500 |
| 4 kW | $9,600–$12,600 | +$72,900 | +$71,500 | +$69,900 |
| 5 kW | $12,000–$15,750 | +$89,000 | +$87,200 | +$85,200 |
| 6 kW | $14,400–$18,900 | +$102,700 | +$100,600 | +$98,200 |
| 8 kW | $19,200–$25,200 | +$117,600 | +$114,800 | +$111,600 |
Bigger builds more total wealth (worthwhile up to about 100% of your usage); the price you pay barely dents the total compared with how much roof you fill. The return rate is highest on a small system; the total dollars keep climbing with size.
8. Your usage shape: what moves the number (and what doesn’t)
We modelled real household load shapes — the daily rhythm of when you actually use power — to test what changes the economics. Two findings, and the second one is unusual.
Big electric loads make solar worth more
An EV, a pool pump, heavy AC, an electric water heater — each adds thousands of kilowatt-hours a year, pushing you into the expensive upper tiers. And because solar erases your most expensive kWh first, every one of those devices makes the same $10k system save more:
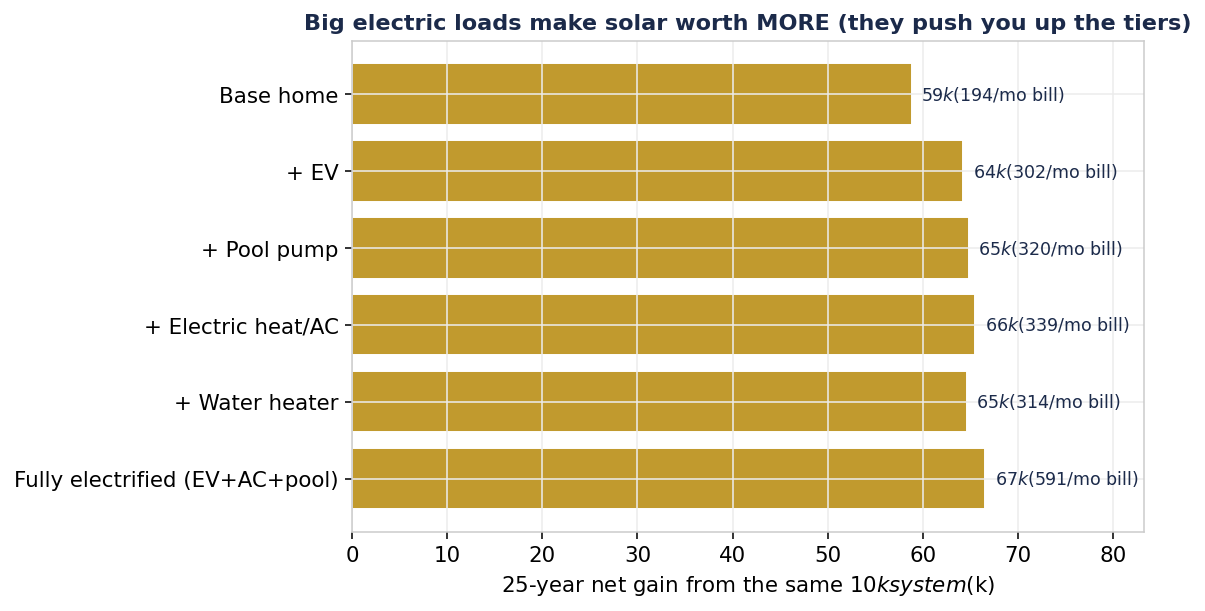
If you’re planning to electrify — an EV in the driveway, a heat pump, induction — solar’s case gets stronger, not weaker. The devices that scare you about your bill are exactly what make your roof pay.
Work from home or commute? It doesn’t matter
Here’s the unusual part. On most California utilities (the NEM 3.0 ones), when you use power is everything — a work-from-home household and an office commuter get very different solar value, because exports are nearly worthless and only power used the instant it’s made counts.
Not on LADWP. Because the tiers reset monthly and exports net at full retail over the month, only your total monthly kWh matters — not the hour you use them. We ran the same home as a work-from-home profile and as a weekday-office profile, and the solar savings came out identical to the dollar ($1,893/year both ways). You don’t have to rearrange your life, buy a battery, or run the dishwasher at noon. Full-retail net metering is that forgiving.
9. What size should you buy?
“$10k” is a budget, not a law. So we swept system size for a typical 1,000 kWh/month home:
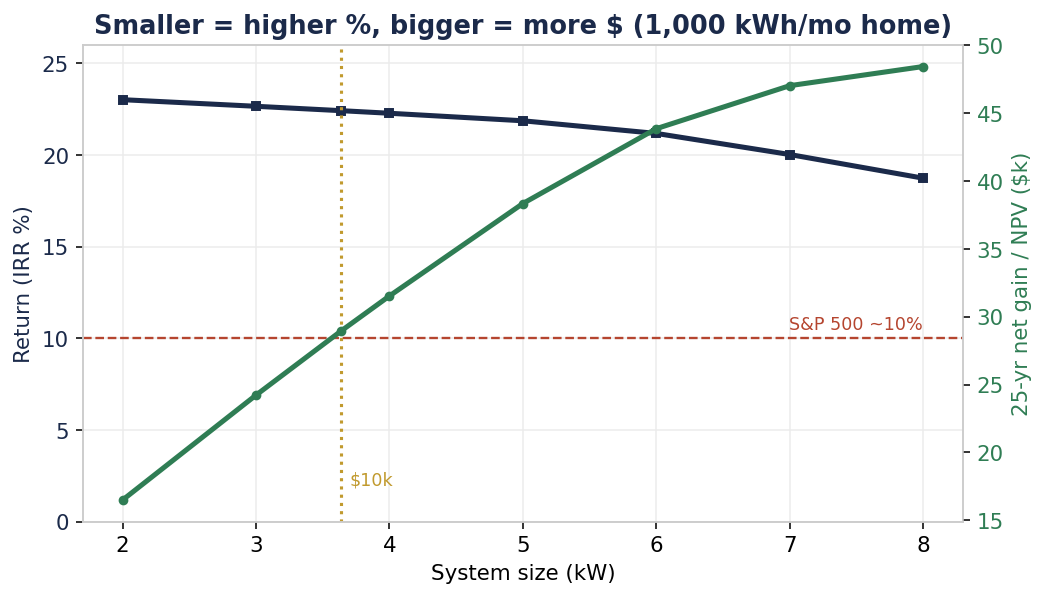
There are two different “best” sizes, and which you want depends on your goal:
- Max return per dollar: a smaller system (~2–3 kW) posts the highest IRR (~23%), because every panel offsets only the most expensive tiers.
- Max total wealth: keep adding panels up to about 100% of your usage — each one still earns a great return, and the dollars pile up ($48k+ of 25-year net gain at ~7 kW). Past 100%, returns fall off, because LADWP doesn’t pay cash for surplus.
A $10k system sits in the sweet spot for most homes: ~22% IRR, ~$29k of 25-year net gain, covering about half a typical home’s usage with room to grow.
10. Stay on the tiered rate (don’t switch to time-of-use)
LADWP lets most homes choose between its tiered rate (R-1A) and a time-of-use rate (R-1B). Installers sometimes push TOU. For a solar home without a battery, that’s usually the wrong move:
| Usage | Solar savings on tiered (R-1A) | Solar savings on TOU (R-1B) | Tiered advantage |
|---|---|---|---|
| 600 kWh/mo | ~$1,860/yr | ~$1,460/yr | +$406/yr |
| 1,000 kWh/mo | ~$2,150/yr | ~$1,450/yr | +$692/yr |
| 1,600 kWh/mo | ~$2,310/yr | ~$1,450/yr | +$859/yr |
The tiered rate wins because solar erases 41¢ top-tier kilowatt-hours; on TOU, midday solar is valued at lower rates. The advantage grows with usage. Two notes: LADWP forces you onto TOU only if you average above 3,000 kWh/month (very few homes), and the old “lesser of the two rates” option (Rate C) has been closed to new customers since 2010 — so this is a real choice you have to get right. (Our TOU figure is a close approximation; your installer should confirm the exact rate for your profile.)
11. Does a battery make sense?
We’re solar-only everywhere above, on purpose. Here’s why: on a tiered, full-retail-net-metering utility like LADWP, a battery has almost nothing to do economically. There’s no steep peak-vs-off-peak price gap to arbitrage, and your exported solar already earns full retail. So a battery just adds cost.
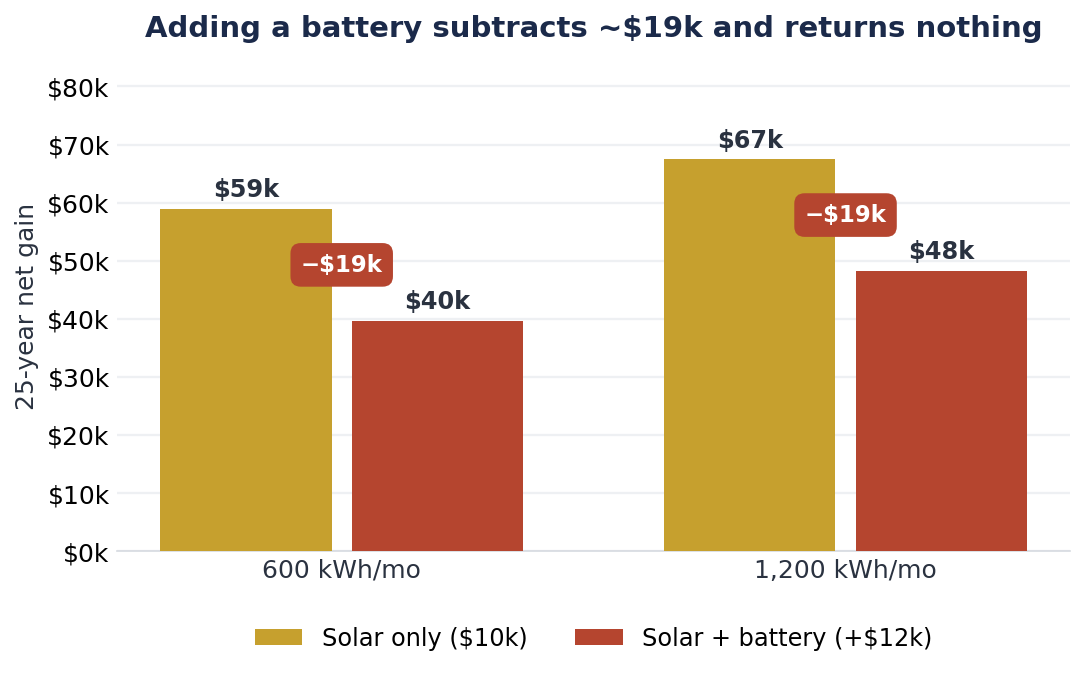
A battery is a fine purchase — for backup power in an outage, which has real value to some households. It is not an investment, and nobody should sell it to you as one. If backup matters to you, buy the smallest battery that covers your essentials.
12. What this does not tell you
- Your roof is your roof. We modelled 50 real roofs to capture the range, but a heavily shaded or north-facing roof will do worse. Get yours measured.
- Rules can change. LADWP’s full-retail net metering is a policy, not a law of nature. It’s been stable and LADWP has announced no plans to end it — but a future change would lower these returns. Today’s buyer locks in today’s rules for their system.
- No subsidies assumed. These returns include zero federal tax credit and zero LADWP rebate. They stand on rate structure alone.
- Estimates, not quotes. Every figure is modelled. The point of our tool is that you can reproduce it on your own numbers.
13. Method & sources
How we worked it out
For each rooftop we ran the same pipeline a homeowner runs for free in our studio — address in, 25-year number out:
- Roof from imagery. Google’s Solar model measures each roof’s planes, tilt, orientation and shading.
- A year of production, simulated hour-by-hour from local weather, per roof plane.
- System & price. A $10,000 cash system at $2.40–$3.15/W, no federal credit, no rebate.
- LADWP’s exact tariff, applied month-by-month: tiered R-1A energy charges, the 10% city tax, the tiered Power Access Charge, and full-retail net metering.
- A 25-year cash flow — escalation, degradation, maintenance, inverter replacement — yielding payback, 25-year net, and IRR.
Assumptions
| Input | Value | Source / note |
|---|---|---|
| Rooftops | 50 real Los Angeles roofs | Google Solar geometry + hourly weather simulation |
| System price | $2.40 / $2.75 / $3.15 per watt | EnergySage, solar.com, NREL — LA, 2026 |
| Federal tax credit | 0% | Residential clean-energy credit expired 31 Dec 2025 |
| LADWP rebate | $0 | Solar Incentive Program closed 2018 |
| Net metering | Full retail (1.0) | LADWP NEM Rider — not NEM 3.0 (municipal utility, outside CPUC) |
| Rate escalation | 4%/yr (3–6% tested) | LADWP’s recent annual increases |
| Degradation / O&M / horizon | 0.5%/yr / ~$20/kW-yr / 25 yr | Planning assumptions |
| Market benchmark | ~10% nominal, ~7% after tax | S&P 500 long-run average (Investopedia); after long-term capital-gains tax |
| LADWP rates | R-1A, month-by-month | Reconstructed to the cent from the Electric Rate Summary (base charges), Residential Adjustment Billing Factors (quarterly factors), and Electric Rate Ordinance (structure & NEM rules) |
Reproducible by you. Enter your address and 12 months of usage in the SIA Solar Design Studio and you get these same figures for your own home. That’s the whole point — we’d rather you check our work than trust it. Sources: LADWP Electric Rate Ordinance · Residential Adjustment Billing Factors.
One honest note on the sample: the 50 rooftops are real Los Angeles-area homes whose production we measured from imagery; rooftop output depends on the sun and the roof, not on which utility sends the bill, so they’re a representative LA sample, and every rate figure is LADWP’s own.
Got $10k and the conviction — but not the appetite for the hassle?
Let us put your $10k into the best version of this investment — and pay you $250 for it.
You’ve seen the math. If you’d rather not deal with the quotes, the installer-vetting and the haggling, our free white-glove service does all of it: we design the best system for your roof, make sure you’re not overpaying, and match you with one vetted installer. We even pay you $250 when your system switches on. It’s the hassle-free way to capture the 17–23% this study found — not a watered-down version of it.
Start my free white-glove analysis How the white-glove service works →
Free · no sales calls · built by the person who wrote this study · you stay in charge and sign with the installer yourself.
Prefer to do it yourself? Build it in the studio — same engine, same numbers, free.